Chapter 11. SNMP
This chapter will explain the Simple Network Management Protocol (SNMP). All values in Chapter 10. Monitoring & Statistics can also be provided by SNMP. Moreover, SNMP can provide more subdivided time units and more detailed system status information. Real-time statistics and statistics averaged over a number of minutes (up to 60) per each virtual host can be provided.
- No additional package is required.
- SNMP is not run separately.
- Supports SNMP v1 and v2c.
Variables
Values that can be changed by a configuration or intentionally by the administrator will be specified as [variable name]. For example, if multiple disks exist, each disk will be represented by a number, assigned in order starting from one. This variable will be labeled as [diskIndex].
[diskIndex]Stands for the disks configured in storage.
# server.xml - <Server><Cache>

<Storage>
   <Disk>/cache1</Disk>
   <Disk>/cache2</Disk>
   <Disk>/cache3</Disk>
</Storage>
In the above environment with three configured disks, /cache1 has a
[diskIndex]of 1 while /cache3 has a[diskIndex]of 3. For example, the OID that refers to the entire volume of /cache1 is system.diskInfo.diskInfoTotalSize.1 (1.3.6.1.4.1.40001.1.2.18.1.3.1). The last .1 refers to the first disk.
[vhostIndex]Automatically assigned when virtual hosts are loaded.
# vhosts.xml

<Vhosts>
   <Vhost Status="Active" Name="kim.com"> ... </Vhost>
   <Vhost Status="Active" Name="lee.com"> ... </Vhost>
   <Vhost Status="Active" Name="park.com" StaticIndex="10300"> ... </Vhost>
</Vhosts>
In the example above, the first three virtual hosts loaded will be assigned a
[vhostIndex]in order starting from 1. The virtual host will remember this[vhostIndex], and the indexes will not change even if virtual hosts are deleted. If virtual host deletion and loading take place at the same time, deletion will occur first, and the new new loaded virtual host will be assigned the empty[vhostIndex].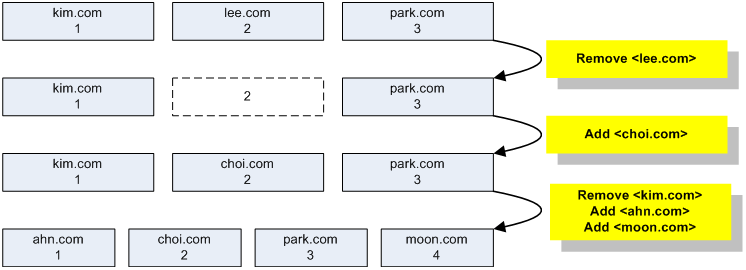
Behavior of
[vhostIndex]
[diskMin],[vhostMin]Refers to time in minutes. A value of 5 refers to an average over the last 5 minutes, while a value of 60 refers to an average over the last 60 minutes. This value has a range of 0 to 60, where 0 refers to real-time (1 second) data.
SNMP uses table structures for items with values that can change dynamically. For example, the number of values in “total disk size” can change with the number of disks, so a table is used. STON provides virtual host statistics in minute increments, allowing for more complex expressions such as “[vhostMin] . [vhostIndex]”.
This expression allows you to request statistics for each virtual host at your desired time increment, but because there are two variables, it is hard to represent in a table. This problem can be solved by setting a default value for [vhostMin] for SNMPWalk to run.
Activation
SNMP behavior and ACL can be configured in global settings (server.xml).
# server.xml - <Server><Host>

<SNMP Port="161" Status="Inactive">
   <Allow>192.168.5.1</Allow>
   <Allow>192.168.6.0/24</Allow>
</SNMP>
<SNMP>SNMP behavior can be configured using these properties.
Port (default: 161)SNMP service port.Status (default: Inactive)Activates SNMP when set toActive.
<Allow>Configures IP addresses that allow SNMP access. Designated IP, designated IP range, bitmask, and subnet forms are supported. If the connected socket is not one of the approved IPs, no response is returned.
Virtual Host/View Variables
The number of virtual host/View variables and default time (minutes) provided by SNMP can be configured.
# server.xml - <Server><Host>

<SNMP VHostCount=0, VHostMin=5 ViewCount=0, ViewMin=5 />
VHostCount (default: 0)If set to 0, only existing virtual hosts respond. If greater than 0, all configured virtual hosts will respond whether they exist or not.ViewCount (default: 0)Applies to View. (Same asVHostCount)VHostMin (default: 5 min, maximum: 60 min)Configures the value of[vhostMin]. Has a range of 0 to 60, with 0 resulting in real-time data and 1~60 resulting in an average over the set amount of time.ViewMin (default: 0)Applies to View. (Same asVHostMin)
In an example with three configured virtual hosts, SNMPWalk’s behavior can differ.
If VHostCount=0
SNMPv2-SMI::enterprises.40001.1.4.2.1.2.1 = STRING: "web.winesoft.co.kr"
SNMPv2-SMI::enterprises.40001.1.4.2.1.2.2 = STRING: "img.winesoft.co.kr"
SNMPv2-SMI::enterprises.40001.1.4.2.1.2.3 = STRING: "vod.winesoft.co.kr"
If VHostCount=5
SNMPv2-SMI::enterprises.40001.1.4.2.1.2.1 = STRING: "web.winesoft.co.kr"
SNMPv2-SMI::enterprises.40001.1.4.2.1.2.2 = STRING: "img.winesoft.co.kr"
SNMPv2-SMI::enterprises.40001.1.4.2.1.2.3 = STRING: "vod.winesoft.co.kr"
SNMPv2-SMI::enterprises.40001.1.4.2.1.2.4 = ""
SNMPv2-SMI::enterprises.40001.1.4.2.1.2.5 = ""
Other Variables
Other variables can be configured.
# server.xml - <Server><Host>

<SNMP GlobalMin="5" DiskMin="5" ConfCount="10" />
GlobalMin (default: 5 min, maximum: 60 min)Sets the value of[globalMin].DiskMin (default: 5 min, maximum: 60 min)Sets the value of[diskMin].ConfCount (default: 10)Browses previous configuration lists. Has a range of 1 to 100. 1 will browse only the current configuration, and 2 will browse the current and previous configurations. Therefore, a value of 100 allows you to browse the current configuration and the past 99 configurations.
Community
Community can be configured to allow/deny access to the given OIDs.
# server.xml - <Server><Host>

<SNMP UnregisteredCommunity="Allow">
   <Community Name="example1" OID="Allow">
      <OID>1.3.6.1.4.1.40001.1.4.1</OID>
      <OID>1.3.6.1.4.1.40001.1.4.2</OID>
      <OID>1.3.6.1.4.1.40001.1.4.4</OID>
   </Community>
   <Community Name="example2" OID="Deny">
      <OID>1.3.6.1.4.1.40001.1.4.3.1.11.11.10.1-61</OID>
   </Community>
</SNMP>
If the UnregisteredCommunity value in <SNMP> is set to “Deny”, unregistered Community requests will be blocked.
<Community>Configures Community.NameThe Community name.OID (default: Allow)Configures the access of the<OID>tags below. If set toAllow, only the<OID>tags below will be allowed access. If set toDeny, the<OID>tags below will be denied access.
Specific OID (1.3.6.1.4.1.40001.1.4.4) and ranged OID (1.3.6.1.4.1.40001.1.4.3.1.11.11.10.1-61) formats are supported. When OIDs are allowed/denied, all OIDs set below will be configured the same way.
meta
OID = 1.3.6.1.4.1.40001.1.1
Provides meta information.
| OID | Name | Type | Description |
|---|---|---|---|
| .1 | manufacture | String | “WineSOFT Inc.” |
| .2 | software | String | “STON” |
| .3 | version | String | Version |
| .4 | hostname | String | Host Name |
| .5 | state | String | “Healthy” or “Inactive” or “Emergency” |
| .6 | uptime | Integer | Runtime (seconds) |
| .7 | admin | String | <Admin> … </Admin> |
| .10 | Conf | OID | Conf expansion |
meta.conf
OID = 1.3.6.1.4.1.40001.1.1.10
[confIndex] is set in the ConfCount property of <SNMP>. A [confIndex] of 1 always refers to the current configuration values, while 2 refers to the previous configuration values. If [confIndex] is 10, the ninth past configuration values will be returned.
| OID | Name | Type | Description |
|---|---|---|---|
.1. [confIndex] |
ID | Integer | Configuration ID |
.2. [confIndex] |
Time | Integer | Configuration time (Unix time) |
.3. [confIndex] |
Type | Integer | Configuration type (0 = Unknown, 1 = STON start, 2 = /conf/reload, 3 = /conf/upload, 4 = /conf/restore) |
.4. [confIndex] |
Size | Integer | Configuration file size |
.5. [confIndex] |
Hash | String | Configuration file Hash string |
.6. [confIndex] |
Path | String | Saved path of the configuration file |
.7. [confIndex] |
Ver | String | STON version of the configuration |
system
OID = 1.3.6.1.4.1.40001.1.2
Provides information about the system running STON. The [sysMin] variable can be set from 0~60 minutes, allowing either real-time or averaged data. The [sysMin] in SNMPWalk can also be set to 0 to provide current information.
| OID | Name | Type | Description |
|---|---|---|---|
.1. [sysMin] |
cpuTotal | Integer | Total CPU usage (100%) |
.2. [sysMin] |
Total CPU usage (10000%) | ||
.3. [sysMin] |
cpuKernel | Integer | CPU(Kernel) usage (100%) |
.4. [sysMin] |
CPU(Kernel) usage (10000%) | ||
.5. [sysMin] |
cpuUser | Integer | CPU(User) usage (100%) |
.6. [sysMin] |
CPU(User) usage (10000%) | ||
.7. [sysMin] |
cpuIdle | Integer | CPU(Idle) usage (100%) |
.8. [sysMin] |
CPU(Idle) usage (10000%) | ||
| .9 | memTotal | Integer | Total system memory (KB) |
.10. [sysMin] |
memUse | Integer | Used system memory (KB) |
.11. [sysMin] |
memFree | Integer | Free system memory (KB) |
.12. [sysMin] |
memSTON | Integer | Memory used by STON (KB) |
.13. [sysMin] |
memUseRatio | Integer | System memory usage (100%) |
.14. [sysMin] |
System memory usage (10000%) | ||
.15. [sysMin] |
memSTONRatio | Integer | STON memory usage (100%) |
.16. [sysMin] |
STON memory usage (10000%) | ||
| .17 | diskCount | Integer | Disk count |
| .18.1 | diskInfo | OID | diskInfo expansion |
| .19.1 | diskPerf | OID | diskPerf expansion |
.20. [sysMin] |
cpuProcKernel | Integer | Usage of CPU(Kernel) by STON (100%) |
.21. [sysMin] |
Usage of CPU(Kernel) by STON (10000%) | ||
.22. [sysMin] |
cpuProcUser | Integer | Usage of CPU(User) by STON (100%) |
.23. [sysMin] |
Usage of CPU(User) by STON (10000%) | ||
.24. [sysMin] |
sysLoadAverage | Integer | Load Average of 1 minute (0.01) |
.25. [sysMin] |
Load Average of 5 minutes (0.01) | ||
.26. [sysMin] |
Load Average ot 15 minutes (0.01) | ||
.27. [sysMin] |
cpuNice | Integer | CPU(Nice) (100%) |
.28. [sysMin] |
CPU(Nice) (10000%) | ||
.29. [sysMin] |
cpuIOWait | Integer | CPU(IOWait) (100%) |
.30. [sysMin] |
CPU(IOWait) (10000%) | ||
.31. [sysMin] |
cpuIRQ | Integer | CPU(IRQ) (100%) |
.32. [sysMin] |
CPU(IRQ) (10000%) | ||
.33. [sysMin] |
cpuSoftIRQ | Integer | CPU(SoftIRQ) (100%) |
.34. [sysMin] |
CPU(SoftIRQ) (10000%) | ||
.35. [sysMin] |
cpuSteal | Integer | CPU(Steal) (100%) |
.36. [sysMin] |
Integer | CPU(Steal) (10000%) | |
.40. [sysMin] |
TCPSocket.Established. [globalMin] |
Integer | Number of established TCP connections |
.41. [sysMin] |
TCPSocket.Timewait. [globalMin] |
Integer | Number of TIME_WAIT TCP connections |
.42. [sysMin] |
TCPSocket.Orphan. [globalMin] |
Integer | Number of orphaned TCP connections |
.43. [sysMin] |
TCPSocket.Alloc. [globalMin] |
Integer | Number of allocated TCP connections |
.44. [sysMin] |
TCPSocket.Mem. [globalMin] |
Integer | TCP connection memory usage |
system.diskInfo
OID = 1.3.6.1.4.1.40001.1.2.18.1
Provides disk information.
| OID | Name | Type | Description |
|---|---|---|---|
.2. [diskIndex] |
diskInfoPath | String | Disk path |
.3. [diskIndex] |
diskInfoTotalSize | Integer | Total disk size (MB) |
.4. [diskIndex] |
diskInfoUseSize | Integer | Disk usage (MB) |
.5. [diskIndex] |
diskInfoFreeSize | Integer | Free disk size (MB) |
.6. [diskIndex] |
diskInfoUseRatio | Integer | Disk usage ratio (100%) |
.7. [diskIndex] |
Disk usage ratio (10000%) | ||
.8. [diskIndex] |
diskInfoStatus | String | “Normal” or “Invalid” or “Unmounted” |
system.diskPerf
OID = 1.3.6.1.4.1.40001.1.2.19.1
Provides disk performance status.
| OID | Name | Type | Description |
|---|---|---|---|
.2. [diskMin] . [diskIndex] |
diskPerfReadCount | Integer | Successful Read count |
.3. [diskMin] . [diskIndex] |
diskPerfReadMergedCount | Integer | Merged Read count |
.4. [diskMin] . [diskIndex] |
diskPerfReadSectorsCount | Integer | Read sectors count |
.5. [diskMin] . [diskIndex] |
diskPerfReadTime | Integer | Elapsed Read time (ms) |
.6. [diskMin] . [diskIndex] |
diskPerfWriteCount | Integer | Successful Write count |
.7. [diskMin] . [diskIndex] |
diskPerfWriteMergedCount | Integer | Merged Write count |
.8. [diskMin] . [diskIndex] |
diskPerfWriteSectorsCount | Integer | Written sectors count |
.9. [diskMin] . [diskIndex] |
diskPerfWriteTime | Integer | Elapsed Write time (ms) |
.10. [diskMin] . [diskIndex] |
diskPerfIOProgressCount | Integer | Number of IO in progress |
.11. [diskMin] . [diskIndex] |
diskPerfIOTime | Integer | Elapsed IO time (ms) |
.12. [diskMin] . [diskIndex] |
diskPerfIOTimeWeighted | Integer | Elapsed IO time (ms, weighted values) |
global
OID = 1.3.6.1.4.1.40001.1.3
Provides resource information (e.g. sockets, events) shared by all modules.
- ServerSocket
- The client-STON connection. This socket is used by STON to process client requests.
- ClientSocket
- The STON-origin server connection. This socket is used by STON to send requests to the origin server.
| OID | Name | Type | Description |
|---|---|---|---|
| .5 | EQ. [globalMin] |
Integer | The number of unprocessed Events in the STON Framework |
| .6 | RQ. [globalMin] |
Integer | The number of Events saved in the recently serviced content reference queue |
| .7 | waitingFiles2Write. [globalMin] |
Integer | The number of write pending files |
| .10 | ServerSocket.Total. [globalMin] |
Integer | Total number of server sockets |
| .11 | ServerSocket.Established. [globalMin] |
Integer | Total number of connected server sockets |
| .12 | ServerSocket.Accepted. [globalMin] |
Integer | Total number of newly connected server sockets |
| .13 | ServerSocket.Closed. [globalMin] |
Integer | The number of closed server sockets |
| .20 | ClientSocket.Total. [globalMin] |
Integer | Total number of client sockets |
| .21 | ClientSocket.Established. [globalMin] |
Integer | Total number of connected client sockets |
| .22 | ClientSocket.Accepted. [globalMin] |
Integer | Total number of newly connected client sockets |
| .23 | ClientSocket.Closed. [globalMin] |
Integer | The number of closed client sockets |
| .30 | ServiceAccess.Allow. [globalMin] |
Integer | The number of allowed(Allow) sockets by ServiceAccess |
| .31 | ServiceAccess.Deny. [globalMin] |
Integer | The number of denied(Deny) sockets by ServiceAccess |
cache
OID = 1.3.6.1.4.1.40001.1.4
Cache service statistics are collected and provided in detail for each virtual host.
| OID | Name | Type | Description |
|---|---|---|---|
| .1 | host | OID | Host (expansion) |
| .2 | vhostCount | Integer | The number of virtual hosts |
| .3.1 | vhost | OID | Statistics for each virtual host |
| .4 | vhostIndexMax | Integer | Max value of [vhostIndex]. SNMPWalk works based on this value. |
| .10 | viewCount | Integer | View count |
| .11.1 | view | OID | Stats per View |
| .12 | viewIndexMax | Integer | Max value of [viewIndex]. SNMPWalk works based on this value. |
cache.host
OID = 1.3.6.1.4.1.40001.1.4.1
Provides information of all virtual hosts.
| OID | Name | Type | Description |
|---|---|---|---|
| .2 | name | String | Host name |
| .3 | status | String | “Healthy” or “Inactive” |
| .4 | uptime | Integer | STON runtime (seconds) |
| .10 | contents | OID | Content information (expansion) |
| .11 | traffic | OID | Stats (expansion) |
cache.host.contents
OID = 1.3.6.1.4.1.40001.1.4.1.10
Provides statistics for content in the service for all virtual hosts.
| OID | Name | Type | Description |
|---|---|---|---|
| .1 | memory | Integer | Memory caching size (KB) |
| .2 | filesTotalCount | Integer | The number of files in service |
| .3 | filesTotalSize | Integer | Total size of files in service (MB) |
| .10 | filesCountU1KB | Integer | The number of files smaller than 1KB |
| .11 | filesCountU2KB | Integer | The number of files smaller than 2KB |
| .12 | filesCountU4KB | Integer | The number of files smaller than 4KB |
| .13 | filesCountU8KB | Integer | The number of files smaller than 8KB |
| .14 | filesCountU16KB | Integer | The number of files smaller than 16KB |
| .15 | filesCountU32KB | Integer | The number of files smaller than 32KB |
| .16 | filesCountU64KB | Integer | The number of files smaller than 64KB |
| .17 | filesCountU128KB | Integer | The number of files smaller than 128KB |
| .18 | filesCountU256KB | Integer | The number of files smaller than 256KB |
| .19 | filesCountU512KB | Integer | The number of files smaller than 512KB |
| .20 | filesCountU1MB | Integer | The number of files smaller than 1MB |
| .21 | filesCountU2MB | Integer | The number of files smaller than 2MB |
| .22 | filesCountU4MB | Integer | The number of files smaller than 4MB |
| .23 | filesCountU8MB | Integer | The number of files smaller than 8MB |
| .24 | filesCountU16MB | Integer | The number of files smaller than 16MB |
| .25 | filesCountU32MB | Integer | The number of files smaller than 32MB |
| .26 | filesCountU64MB | Integer | The number of files smaller than 64MB |
| .27 | filesCountU128MB | Integer | The number of files smaller than 128MB |
| .28 | filesCountU256MB | Integer | The number of files smaller than 256MB |
| .29 | filesCountU512MB | Integer | The number of files smaller than 512MB |
| .30 | filesCountU1GB | Integer | The number of files smaller than 1GB |
| .31 | filesCountU2GB | Integer | The number of files smaller than 2GB |
| .32 | filesCountU4GB | Integer | The number of files smaller than 4GB |
| .33 | filesCountU8GB | Integer | The number of files smaller than 8GB |
| .34 | filesCountU16GB | Integer | The number of files smaller than 16GB |
| .35 | filesCountO16GB | Integer | The number of files larger than 16GB |
cache.host.traffic
OID = 1.3.6.1.4.1.40001.1.4.1.11
Provides cache service and traffic statistics for all virtual hosts. Traffic statistics are provided as an average of up to 60 minutes. If the time value is omitted or set to 0, statistics will be provided in real time.
| OID | Name | Type | Description |
|---|---|---|---|
.1. [vhostMin] |
requestHitRatio | Integer | Request Hit Ratio (100%) |
.2. [vhostMin] |
Request Hit Ratio (10000%) | ||
.3. [vhostMin] |
bytesHitRatio | Integer | Bytes Hit Ratio (100%) |
.4. [vhostMin] |
Bytes Hit Ratio (10000%) | ||
| .10 | origin | OID | Origin traffic information (expansion) |
| .11 | client | OID | Client traffic information (expansion) |
cache.host.traffic.origin
OID = 1.3.6.1.4.1.40001.1.4.1.11.10
Provides origin server traffic statistics. Origin server traffic is divided into HTTP traffic and port bypass traffic.
| OID | Name | Type | Description |
|---|---|---|---|
.1. [vhostMin] |
inbound | Integer | Average traffic received from the origin server (bytes) |
.2. [vhostMin] |
outbound | Integer | Average traffic sent to the origin server (bytes) |
.3. [vhostMin] |
sessionAverage | Integer | Average origin server session count |
.4. [vhostMin] |
activesessionAverage | Integer | Average origin server transmitting session count |
| .10 | http | OID | Origin server HTTP traffic information |
.10.1. [vhostMin] |
http.inbound | Integer | Average HTTP traffic received from the origin server (bytes) |
.10.2. [vhostMin] |
http.outbound | Integer | Average HTTP traffic sent to the origin server (bytes) |
.10.3. [vhostMin] |
http.sessionAverage | Integer | Average origin server HTTP session count |
.10.4. [vhostMin] |
http.reqHeaderSize | Integer | Average HTTP Header traffic sent to the origin server (bytes) |
.10.5. [vhostMin] |
http.reqBodySize | Integer | Average HTTP Body traffic sent to the origin server (bytes) |
.10.6. [vhostMin] |
http.resHeaderSize | Integer | Average HTTP Header traffic received from the origin server (bytes) |
.10.7. [vhostMin] |
http.resBodySize | Integer | Average HTTP Body traffic received from the origin server (bytes) |
.10.8. [vhostMin] |
http.reqAverage | Integer | Average number of HTTP requests sent to the origin server |
.10.9. [vhostMin] |
http.reqCount | Integer | Total number of HTTP requests sent to the origin server |
.10.10. [vhostMin] |
http.resTotalAverage | Integer | Average number of all HTTP responses received from the origin server |
.10.11. [vhostMin] |
http.resTotalCompleteAverage | Integer | Average number of successful HTTP transactions from the origin server |
.10.12. [vhostMin] |
http.resTotalTimeRes | Integer | Average elapsed time to receive a response header from the origin server (0.01 ms) |
.10.13. [vhostMin] |
http.resTotalTimeComplete | Integer | Average completion time of HTTP transactions from the origin server (0.01 ms) |
.10.14. [vhostMin] |
http.resTotalCount | Integer | Total number of all HTTP responses received from the origin server |
.10.15. [vhostMin] |
http.resTotalCompleteCount | Integer | Total number of successful HTTP transactions from the origin server |
.10.20. [vhostMin] |
http.res2xxAverage | Integer | Number of 2xx responses from the origin server |
.10.21. [vhostMin] |
http.res2xxCompleteAverage | Integer | Number of successful 2xx transactions from the origin server |
.10.22. [vhostMin] |
http.res2xxTimeRes | Integer | Average elapsed time to receive a 2xx header from the origin server (0.01 ms) |
.10.23. [vhostMin] |
http.res2xxTimeComplete | Integer | Average completion time of 2xx transactions from the origin server (0.01 ms) |
.10.24. [vhostMin] |
http.res2xxCount | Integer | Total number of 2xx responses from the origin server |
.10.25. [vhostMin] |
http.res2xxCompleteCount | Integer | Total number of successful 2xx transactions from the origin server |
.10.30. [vhostMin] |
http.res3xxAverage | Integer | Number of 3xx responses from the origin server |
.10.31. [vhostMin] |
http.res3xxCompleteAverage | Integer | Number of successful 3xx transactions from the origin server |
.10.32. [vhostMin] |
http.res3xxTimeRes | Integer | Average elapsed time to receive a 3xx header from the origin server (0.01 ms) |
.10.33. [vhostMin] |
http.res3xxTimeComplete | Integer | Average completion time of 3xx transactions from the origin server (0.01 ms) |
.10.34. [vhostMin] |
http.res3xxCount | Integer | Total number of 3xx responses from the origin server |
.10.35. [vhostMin] |
http.res3xxCompleteCount | Integer | Total number of successful 3xx transactions from the origin server |
.10.40. [vhostMin] |
http.res4xxAverage | Integer | Number of 4xx responses from the origin server |
.10.41. [vhostMin] |
http.res4xxCompleteAverage | Integer | Number of successful 4xx transactions from the origin server |
.10.42. [vhostMin] |
http.res4xxTimeRes | Integer | Average elapsed time to receive a 4xx header from the origin server (0.01 ms) |
.10.43. [vhostMin] |
http.res4xxTimeComplete | Integer | Average completion time of 4xx transactions from the origin server (0.01 ms) |
.10.44. [vhostMin] |
http.res4xxCount | Integer | Total number of 4xx responses from the origin server |
.10.45. [vhostMin] |
http.res4xxCompleteCount | Integer | Total number of successful 4xx transactions from the origin server |
.10.50. [vhostMin] |
http.res5xxAverage | Integer | Number of 5xx responses from the origin server |
.10.51. [vhostMin] |
http.res5xxCompleteAverage | Integer | Number of successful 5xx transactions from the origin server |
.10.52. [vhostMin] |
http.res5xxTimeRes | Integer | Average elapsed time to receive a 5xx header from the origin server (0.01 ms) |
.10.53. [vhostMin] |
http.res5xxTimeComplete | Integer | Average completion time of 5xx transactions from the origin server (0.01 ms) |
.10.54. [vhostMin] |
http.res5xxCount | Integer | Total number of 5xx responses from the origin server |
.10.55. [vhostMin] |
http.res5xxCompleteCount | Integer | Total number of successful 5xx transactions from the origin server |
.10.60. [vhostMin] |
http.connectTimeoutAverage | Integer | Average number of origin server connection timeouts |
.10.61. [vhostMin] |
http.receiveTimeoutAverage | Integer | Average number of origin server reception timeouts |
.10.62. [vhostMin] |
http.connectAverage | Integer | Average number of origin server connection successes |
.10.63. [vhostMin] |
http.dnsQueryTime | Integer | Average DNS query time when connecting to the origin server |
.10.64. [vhostMin] |
http.connectTime | Integer | Origin server average connection time (0.01 ms) |
.10.65. [vhostMin] |
http.connectTimeoutCount | Integer | Total number of origin server connection timeouts |
.10.66. [vhostMin] |
http.receiveTimeoutCount | Integer | Total number of origin server reception timeouts |
.10.67. [vhostMin] |
http.connectCount | Integer | Total number of origin server connection successes |
.10.68. [vhostMin] |
http.closeAverage | Integer | Average number of sockets closed by the origin server during transmission |
.10.69. [vhostMin] |
http.closeCount | Integer | Total number of sockets closed by the origin server during transmission |
| .11 | portbypass | OID | Port bypass origin server traffic information |
.11.1. [vhostMin] |
portbypass.inbound | Integer | Average traffic received from the origin server via port bypass (bytes) |
.11.2. [vhostMin] |
portbypass.outbound | Integer | Average traffic sent to the origin server via port bypass (bytes) |
.11.3. [vhostMin] |
portbypass.sessionAverage | Integer | Average number of origin server sessions in port bypass |
.11.4. [vhostMin] |
portbypass.closedAverage | Integer | Average number of connections closed by the origin server during port bypass |
.11.5. [vhostMin] |
portbypass.connectTimeoutAverage | Integer | Average number of origin server connection timeouts during port bypass |
.11.6. [vhostMin] |
portbypass.closedCount | Integer | Total number of connections closed by the origin server during port bypass |
.11.7. [vhostMin] |
portbypass.connectTimeoutCount | Integer | Total number of origin server connection timeouts during port bypass |
cache.host.traffic.client
OID = 1.3.6.1.4.1.40001.1.4.1.11.11
Provides client traffic statistics. Client traffic is divided into HTTP traffic, SSL traffic, and port bypass traffic. SNMP does not provide statistics for each directory. Even if directory statistics are configured, the data will be accumulated before being provided.
| OID | Name | Type | Description |
|---|---|---|---|
.1. [vhostMin] |
inbound | Integer | Average traffic received from clients (bytes) |
.2. [vhostMin] |
outbound | Integer | Average traffic sent to clients (bytes) |
.3. [vhostMin] |
sessionAverage | Integer | Average client session count |
.4. [vhostMin] |
activesessionAverage | Integer | Average client transmitting session count |
| .10 | http | OID | Client HTTP traffic information |
.10.1. [vhostMin] |
http.inbound | Integer | Average HTTP traffic received from clients (bytes) |
.10.2. [vhostMin] |
http.outbound | Integer | Average HTTP traffic sent to clients (bytes) |
.10.3. [vhostMin] |
http.sessionAverage | Integer | Average client HTTP session count |
.10.4. [vhostMin] |
http.reqHeaderSize | Integer | Average HTTP Header traffic received from clients (bytes) |
.10.5. [vhostMin] |
http.reqBodySize | Integer | Average HTTP Body traffic received from clients (bytes) |
.10.6. [vhostMin] |
http.resHeaderSize | Integer | Average HTTP Header traffic sent to clients (bytes) |
.10.7. [vhostMin] |
http.resBodySize | Integer | Average HTTP Body traffic sent to clients (bytes) |
.10.8. [vhostMin] |
http.reqAverage | Integer | Average number of HTTP requests received from clients |
.10.9. [vhostMin] |
http.reqCount | Integer | Total number of HTTP requests received from clients |
.10.10. [vhostMin] |
http.resTotalAverage | Integer | Average number of all HTTP responses sent to clients |
.10.11. [vhostMin] |
http.resTotalCompleteAverage | Integer | Average number of HTTP transactions completed by clients |
.10.12. [vhostMin] |
http.resTotalTimeRes | Integer | Average elapsed time of client responses (0.01ms) |
.10.13. [vhostMin] |
http.resTotalTimeComplete | Integer | Average elapsed time of client HTTP transactions (0.01 ms) |
.10.14. [vhostMin] |
http.resTotalCount | Integer | Total number of all HTTP responses sent to clients |
.10.15. [vhostMin] |
http.resTotalCompleteCount | Integer | Total number of HTTP transactions completed by clients |
.10.20. [vhostMin] |
http.res2xxAverage | Integer | Average number of 2xx responses sent to clients |
.10.21. [vhostMin] |
http.res2xxCompleteAverage | Integer | Average number of 2xx transactions completed by clients |
.10.22. [vhostMin] |
http.res2xxTimeRes | Integer | Average elapsed time of client 2xx responses (0.01 ms) |
.10.23. [vhostMin] |
http.res2xxTimeComplete | Integer | Average completion time of client 2xx transactions (0.01 ms) |
.10.24. [vhostMin] |
http.res2xxCount | Integer | Total number of 2xx responses sent to clients |
.10.25. [vhostMin] |
http.res2xxCompleteCount | Integer | Total number of 2xx transactions completed by clients |
.10.30. [vhostMin] |
http.res3xxAverage | Integer | Average number of 3xx responses sent to clients |
.10.31. [vhostMin] |
http.res3xxCompleteAverage | Integer | Average number of 3xx transactions completed by clients |
.10.32. [vhostMin] |
http.res3xxTimeRes | Integer | Average elapsed time of client 3xx responses (0.01 ms) |
.10.33. [vhostMin] |
http.res3xxTimeComplete | Integer | Average completion time of client 3xx transactions (0.01 ms) |
.10.34. [vhostMin] |
http.res3xxCount | Integer | Total number of 3xx responses sent to clients |
.10.35. [vhostMin] |
http.res3xxCompleteCount | Integer | Total number of 3xx transactions completed by clients |
.10.40. [vhostMin] |
http.res4xxAverage | Integer | Average number of 4xx responses sent to clients |
.10.41. [vhostMin] |
http.res4xxCompleteAverage | Integer | Average number of 4xx transactions completed by clients |
.10.42. [vhostMin] |
http.res4xxTimeRes | Integer | Average elapsed time of client 4xx responses (0.01 ms) |
.10.43. [vhostMin] |
http.res4xxTimeComplete | Integer | Average completion time of client 4xx transactions (0.01 ms) |
.10.44. [vhostMin] |
http.res4xxCount | Integer | Total number of 4xx responses sent to clients |
.10.45. [vhostMin] |
http.res4xxCompleteCount | Integer | Total number of 4xx transactions completed by clients |
.10.50. [vhostMin] |
http.res5xxAverage | Integer | Average number of 5xx responses sent to clients |
.10.51. [vhostMin] |
http.res5xxCompleteAverage | Integer | Average number of 5xx transactions completed by clients |
.10.52. [vhostMin] |
http.res5xxTimeRes | Integer | Average elapsed time of client 5xx responses (0.01 ms) |
.10.53. [vhostMin] |
http.res5xxTimeComplete | Integer | Average completion time of client 5xx transactions (0.01 ms) |
.10.54. [vhostMin] |
http.res5xxCount | Integer | Total number of 5xx responses sent to clients |
.10.55. [vhostMin] |
http.res5xxCompleteCount | Integer | Total number of 5xx transactions completed by clients |
.10.60. [vhostMin] |
http.reqDeniedAverage | Integer | Average number of denied requests |
.10.61. [vhostMin] |
http.reqDeniedCount | Integer | Total number of denied requests |
| .11 | portbypass | OID | Port bypass client traffic information |
.11.1. [vhostMin] |
portbypass.inbound | Integer | Average traffic received from clients via port bypass (bytes) |
.11.2. [vhostMin] |
portbypass.outbound | Integer | Average traffic sent to clients via port bypass (bytes) |
.11.3. [vhostMin] |
portbypass.sessionAverage | Integer | Average number of client sessions in port bypass |
.11.4. [vhostMin] |
portbypass.closedAverage | Integer | Average number of connections closed by clients during port bypass |
.11.5. [vhostMin] |
portbypass.closedCount | Integer | Total number of connections closed by clients during port bypass |
| .12 | ssl | OID | SSL client traffic information |
.12.2. [vhostMin] |
ssl.inbound | Integer | Average traffic received from clients via SSL (bytes) |
.12.3. [vhostMin] |
ssl.outbound | Integer | Average traffic sent to clients via SSL (bytes) |
| .13 | requestHitAverage | OID | Average number of cache HIT results |
.13.1. [vhostMin] |
requestHitAverage.TCP_HIT | Integer | TCP_HIT |
.13.2. [vhostMin] |
requestHitAverage.TCP_IMS_HIT | Integer | TCP_IMS_HIT |
.13.3. [vhostMin] |
requestHitAverage.TCP_REFRESH_HIT | Integer | TCP_REFRESH_HIT |
.13.4. [vhostMin] |
requestHitAverage.TCP_REF_FAIL_HIT | Integer | TCP_REF_FAIL_HIT |
.13.5. [vhostMin] |
requestHitAverage.TCP_NEGATIVE_HIT | Integer | TCP_NEGATIVE_HIT |
.13.6. [vhostMin] |
requestHitAverage.TCP_MISS | Integer | TCP_MISS |
.13.7. [vhostMin] |
requestHitAverage.TCP_REFRESH_MISS | Integer | TCP_REFRESH_MISS |
.13.8. [vhostMin] |
requestHitAverage.TCP_CLIENT_REFRESH_MISS | Integer | TCP_CLIENT_REFRESH_MISS |
.13.9. [vhostMin] |
requestHitAverage.TCP_DENIED | Integer | TCP_DENIED |
.13.10. [vhostMin] |
requestHitAverage.TCP_ERROR | Integer | TCP_ERROR |
.13.11. [vhostMin] |
requestHitAverage.TCP_REDIRECT_HIT | Integer | TCP_REDIRECT_HIT |
| .14 | requestHitCount | OID | Total number of cache HIT results |
.14.1. [vhostMin] |
requestHitCount.TCP_HIT | Integer | TCP_HIT |
.14.2. [vhostMin] |
requestHitCount.TCP_IMS_HIT | Integer | TCP_IMS_HIT |
.14.3. [vhostMin] |
requestHitCount.TCP_REFRESH_HIT | Integer | TCP_REFRESH_HIT |
.14.4. [vhostMin] |
requestHitCount.TCP_REF_FAIL_HIT | Integer | TCP_REF_FAIL_HIT |
.14.5. [vhostMin] |
requestHitCount.TCP_NEGATIVE_HIT | Integer | TCP_NEGATIVE_HIT |
.14.6. [vhostMin] |
requestHitCount.TCP_MISS | Integer | TCP_MISS |
.14.7. [vhostMin] |
requestHitCount.TCP_REFRESH_MISS | Integer | TCP_REFRESH_MISS |
.14.8. [vhostMin] |
requestHitCount.TCP_CLIENT_REFRESH_MISS | Integer | TCP_CLIENT_REFRESH_MISS |
.14.9. [vhostMin] |
requestHitCount.TCP_DENIED | Integer | TCP_DENIED |
.14.10. [vhostMin] |
requestHitCount.TCP_ERROR | Integer | TCP_ERROR |
.14.11. [vhostMin] |
requestHitCount.TCP_REDIRECT_HIT | Integer | TCP_REDIRECT_HIT |
cache.host.traffic.filesystem
OID = 1.3.6.1.4.1.40001.1.4.1.11.20
Provides File I/O statistics of hosts.
| OID | Name | Type | Description |
|---|---|---|---|
.1. [vhostMin] |
requestHitRatio | Integer | Request Hit Ratio (100%) |
.2. [vhostMin] |
Request Hit Ratio (10000%) | ||
.3. [vhostMin] |
byteHitRatio | Integer | Byte Hit Ratio (100%) |
.4. [vhostMin] |
Byte Hit Ratio (10000%) | ||
.5. [vhostMin] |
outbound | Integer | Average traffic sent to File I/O (bytes) |
.6. [vhostMin] |
session | Integer | Average number of threads in File I/O |
| .7 | requestHitAverage | OID | Average number of cache HIT results |
.7.1. [vhostMin] |
requestHitAverage.TCP_HIT | Integer | TCP_HIT |
.7.2. [vhostMin] |
requestHitAverage.TCP_IMS_HIT | Integer | TCP_IMS_HIT |
.7.3. [vhostMin] |
requestHitAverage.TCP_REFRESH_HIT | Integer | TCP_REFRESH_HIT |
.7.4. [vhostMin] |
requestHitAverage.TCP_REF_FAIL_HIT | Integer | TCP_REF_FAIL_HIT |
.7.5. [vhostMin] |
requestHitAverage.TCP_NEGATIVE_HIT | Integer | TCP_NEGATIVE_HIT |
.7.6. [vhostMin] |
requestHitAverage.TCP_MISS | Integer | TCP_MISS |
.7.7. [vhostMin] |
requestHitAverage.TCP_REFRESH_MISS | Integer | TCP_REFRESH_MISS |
.7.8. [vhostMin] |
requestHitAverage.TCP_CLIENT_REFRESH_MISS | Integer | TCP_CLIENT_REFRESH_MISS |
.7.9. [vhostMin] |
requestHitAverage.TCP_DENIED | Integer | TCP_DENIED |
.7.10. [vhostMin] |
requestHitAverage.TCP_ERROR | Integer | TCP_ERROR |
.7.11. [vhostMin] |
requestHitAverage.TCP_REDIRECT_HIT | Integer | TCP_REDIRECT_HIT |
| .8 | requestHitCount | OID | Total number of cache HIT results |
.8.1. [vhostMin] |
requestHitCount.TCP_HIT | Integer | TCP_HIT |
.8.2. [vhostMin] |
requestHitCount.TCP_IMS_HIT | Integer | TCP_IMS_HIT |
.8.3. [vhostMin] |
requestHitCount.TCP_REFRESH_HIT | Integer | TCP_REFRESH_HIT |
.8.4. [vhostMin] |
requestHitCount.TCP_REF_FAIL_HIT | Integer | TCP_REF_FAIL_HIT |
.8.5. [vhostMin] |
requestHitCount.TCP_NEGATIVE_HIT | Integer | TCP_NEGATIVE_HIT |
.8.6. [vhostMin] |
requestHitCount.TCP_MISS | Integer | TCP_MISS |
.8.7. [vhostMin] |
requestHitCount.TCP_REFRESH_MISS | Integer | TCP_REFRESH_MISS |
.8.8. [vhostMin] |
requestHitCount.TCP_CLIENT_REFRESH_MISS | Integer | TCP_CLIENT_REFRESH_MISS |
.8.9. [vhostMin] |
requestHitCount.TCP_DENIED | Integer | TCP_DENIED |
.8.10. [vhostMin] |
requestHitCount.TCP_ERROR | Integer | TCP_ERROR |
.8.11. [vhostMin] |
requestHitCount.TCP_REDIRECT_HIT | Integer | TCP_REDIRECT_HIT |
.10. [vhostMin] |
getattr.filecount | Integer | (getattr function call) Number of FILE responses |
.11. [vhostMin] |
getattr.dircount | Integer | (getattr function call) Number of DIR responses |
.12. [vhostMin] |
getattr.failcount | Integer | (getattr function call) Number of failure responses |
.13. [vhostMin] |
getattr.timeres | Integer | (getattr function call) Response time (0.01 ms) |
.14. [vhostMin] |
open.count | Integer | Number of open function calls |
.15. [vhostMin] |
open.timeres | Integer | Response time of the open function (0.01 ms) |
.16. [vhostMin] |
read.count | Integer | Number of read function calls |
.17. [vhostMin] |
read.timeres | Integer | Response time of the read function (0.01 ms) |
.18. [vhostMin] |
read.buffersize | Integer | Size of the buffer requested by the read function (bytes) |
.19. [vhostMin] |
read.bufferfilled | Integer | Size of filled space in the buffer requested by the read function (bytes) |
cache.host.traffic.dims
OID = 1.3.6.1.4.1.40001.1.4.1.11.21
Provides DIMS conversion statistics of hosts.
| OID | Name | Type | Description |
|---|---|---|---|
.1. [vhostMin] |
requests | Integer | Number of DIMS conversion requests |
.2. [vhostMin] |
converted | Integer | Number of conversion successes |
.3. [vhostMin] |
failed | Integer | Number of conversion failures |
.4. [vhostMin] |
avgsrcsize | Integer | Average size of origin images (bytes) |
.5. [vhostMin] |
avgdestsize | Integer | Average size of converted images (bytes) |
.6. [vhostMin] |
avgtime | Integer | Conversion time (ms) |
cache.host.traffic.compression
OID = 1.3.6.1.4.1.40001.1.4.1.11.22
Provides compression statistics of hosts.
| OID | Name | Type | Description |
|---|---|---|---|
.1. [vhostMin] |
requests | Integer | Number of compression requests |
.2. [vhostMin] |
converted | Integer | Number of compression successes |
.3. [vhostMin] |
failed | Integer | Number of compression failures |
.4. [vhostMin] |
avgsrcsize | Integer | Average size of origin files (bytes) |
.5. [vhostMin] |
avgdestsize | Integer | Average size of compressed files (bytes) |
.6. [vhostMin] |
avgtime | Integer | Compression time (ms) |
cache.vhost
OID = 1.3.6.1.4.1.40001.1.4.3.1
Provides virtual host information. [vhostIndex] starts at 1 and ranges up to the number of virtual hosts.
| OID | Name | Type | Description |
|---|---|---|---|
.2. [vhostIndex] |
name | String | Virtual host name |
.3. [vhostIndex] |
status | String | “Healthy” or “Inactive” or “Emergency” |
.4. [vhostIndex] |
uptime | Integer | Virtual host runtime (seconds) |
| .10 | contents | OID | Content information (expansion) |
| .11 | traffic | OID | Statistics (expansion) |
cache.vhost.contents
OID = 1.3.6.1.4.1.40001.1.4.3.1.10
Provides statistics for content in the service for a virtual host.
| OID | Name | Type | Description |
|---|---|---|---|
.1. [vhostIndex] |
memory | Integer | Memory caching size (KB) |
.2. [vhostIndex] |
filesTotalCount | Integer | The number of files in service |
.3. [vhostIndex] |
filesTotalSize | Integer | Total size of files in service (MB) |
.10. [vhostIndex] |
filesCountU1KB | Integer | The number of files smaller than 1KB |
.11. [vhostIndex] |
filesCountU2KB | Integer | The number of files smaller than 2KB |
.12. [vhostIndex] |
filesCountU4KB | Integer | The number of files smaller than 4KB |
.13. [vhostIndex] |
filesCountU8KB | Integer | The number of files smaller than 8KB |
.14. [vhostIndex] |
filesCountU16KB | Integer | The number of files smaller than 16KB |
.15. [vhostIndex] |
filesCountU32KB | Integer | The number of files smaller than 32KB |
.16. [vhostIndex] |
filesCountU64KB | Integer | The number of files smaller than 64KB |
.17. [vhostIndex] |
filesCountU128KB | Integer | The number of files smaller than 128KB |
.18. [vhostIndex] |
filesCountU256KB | Integer | The number of files smaller than 256KB |
.19. [vhostIndex] |
filesCountU512KB | Integer | The number of files smaller than 512KB |
.20. [vhostIndex] |
filesCountU1MB | Integer | The number of files smaller than 1MB |
.21. [vhostIndex] |
filesCountU2MB | Integer | The number of files smaller than 2MB |
.22. [vhostIndex] |
filesCountU4MB | Integer | The number of files smaller than 4MB |
.23. [vhostIndex] |
filesCountU8MB | Integer | The number of files smaller than 8MB |
.24. [vhostIndex] |
filesCountU16MB | Integer | The number of files smaller than 16MB |
.25. [vhostIndex] |
filesCountU32MB | Integer | The number of files smaller than 32MB |
.26. [vhostIndex] |
filesCountU64MB | Integer | The number of files smaller than 64MB |
.27. [vhostIndex] |
filesCountU128MB | Integer | The number of files smaller than 128MB |
.28. [vhostIndex] |
filesCountU256MB | Integer | The number of files smaller than 256MB |
.29. [vhostIndex] |
filesCountU512MB | Integer | The number of files smaller than 512MB |
.30. [vhostIndex] |
filesCountU1GB | Integer | The number of files smaller than 1GB |
.31. [vhostIndex] |
filesCountU2GB | Integer | The number of files smaller than 2GB |
.32. [vhostIndex] |
filesCountU4GB | Integer | The number of files smaller than 4GB |
.33. [vhostIndex] |
filesCountU8GB | Integer | The number of files smaller than 8GB |
.34. [vhostIndex] |
filesCountU16GB | Integer | The number of files smaller than 16GB |
.35. [vhostIndex] |
filesCountO16GB | Integer | The number of files larger than 16GB |
cache.vhost.traffic
OID = 1.3.6.1.4.1.40001.1.4.3.1.11
Provides cache service and traffic statistics for a virtual host. Traffic statistics are provided as an average of up to 60 minutes. If the time value is omitted or set to 0, statistics will be provided in real time.
| OID | Name | Type | Description |
|---|---|---|---|
.1. [vhostMin] . [vhostIndex] |
requestHitRatio | Integer | Request Hit Ratio (100%) |
.2. [vhostMin] . [vhostIndex] |
Request Hit Ratio (10000%) | ||
.3. [vhostMin] . [vhostIndex] |
bytesHitRatio | Integer | Bytes Hit Ratio (100%) |
.4. [vhostMin] . [vhostIndex] |
Bytes Hit Ratio (10000%) | ||
| .10 | origin | OID | Origin traffic information (expansion) |
| .11 | client | OID | Client traffic information (expansion) |
cache.vhost.traffic.origin
OID = 1.3.6.1.4.1.40001.1.4.3.1.11.10
Provides origin server traffic statistics. Origin server traffic is divided into HTTP traffic and port bypass traffic.
| OID | Name | Type | Description |
|---|---|---|---|
.1. [vhostMin] . [vhostIndex] |
inbound | Integer | Average traffic received from the origin server (bytes) |
.2. [vhostMin] . [vhostIndex] |
outbound | Integer | Average traffic sent to the origin server (bytes) |
.3. [vhostMin] . [vhostIndex] |
sessionAverage | Integer | Average origin server session count |
.4. [vhostMin] . [vhostIndex] |
activesessionAverage | Integer | Average origin server transmitting session count |
| .10 | http | OID | Origin server HTTP traffic information |
.10.1. [vhostMin] . [vhostIndex] |
http.inbound | Integer | Average HTTP traffic received from the origin server (bytes) |
.10.2. [vhostMin] . [vhostIndex] |
http.outbound | Integer | Average HTTP traffic sent to the origin server (bytes) |
.10.3. [vhostMin] . [vhostIndex] |
http.sessionAverage | Integer | Average origin server HTTP session count |
.10.4. [vhostMin] . [vhostIndex] |
http.reqHeaderSize | Integer | Average HTTP Header traffic sent to the origin server (bytes) |
.10.5. [vhostMin] . [vhostIndex] |
http.reqBodySize | Integer | Average HTTP Body traffic sent to the origin server (bytes) |
.10.6. [vhostMin] . [vhostIndex] |
http.resHeaderSize | Integer | Average HTTP Header traffic received from the origin server (bytes) |
.10.7. [vhostMin] . [vhostIndex] |
http.resBodySize | Integer | Average HTTP Body traffic received from the origin server (bytes) |
.10.8. [vhostMin] . [vhostIndex] |
http.reqAverage | Integer | Average number of HTTP requests sent to the origin server |
.10.9. [vhostMin] . [vhostIndex] |
http.reqCount | Integer | Total number of HTTP requests sent to the origin server |
.10.10. [vhostMin] . [vhostIndex] |
http.resTotalAverage | Integer | Average number of all HTTP responses received from the origin server |
.10.11. [vhostMin] . [vhostIndex] |
http.resTotalCompleteAverage | Integer | Average number of successful HTTP transactions from the origin server |
.10.12. [vhostMin] . [vhostIndex] |
http.resTotalTimeRes | Integer | Average elapsed time to receive a response header from the origin server (0.01 ms) |
.10.13. [vhostMin] . [vhostIndex] |
http.resTotalTimeComplete | Integer | Average completion time of HTTP transactions from the origin server (0.01 ms) |
.10.14. [vhostMin] . [vhostIndex] |
http.resTotalCount | Integer | Total number of all HTTP responses received from the origin server |
.10.15. [vhostMin] . [vhostIndex] |
http.resTotalCompleteCount | Integer | Total number of successful HTTP transactions from the origin server |
.10.20. [vhostMin] . [vhostIndex] |
http.res2xxAverage | Integer | Number of 2xx responses from the origin server |
.10.21. [vhostMin] . [vhostIndex] |
http.res2xxCompleteAverage | Integer | Number of successful 2xx transactions from the origin server |
.10.22. [vhostMin] . [vhostIndex] |
http.res2xxTimeRes | Integer | Average elapsed time to receive a 2xx header from the origin server (0.01 ms) |
.10.23. [vhostMin] . [vhostIndex] |
http.res2xxTimeComplete | Integer | Average completion time of 2xx transactions from the origin server (0.01 ms) |
.10.24. [vhostMin] . [vhostIndex] |
http.res2xxCount | Integer | Total number of 2xx responses from the origin server |
.10.25. [vhostMin] . [vhostIndex] |
http.res2xxCompleteCount | Integer | Total number of successful 2xx transactions from the origin server |
.10.30. [vhostMin] . [vhostIndex] |
http.res3xxAverage | Integer | Number of 3xx responses from the origin server |
.10.31. [vhostMin] . [vhostIndex] |
http.res3xxCompleteAverage | Integer | Number of successful 3xx transactions from the origin server |
.10.32. [vhostMin] . [vhostIndex] |
http.res3xxTimeRes | Integer | Average elapsed time to receive a 3xx header from the origin server (0.01 ms) |
.10.33. [vhostMin] . [vhostIndex] |
http.res3xxTimeComplete | Integer | Average completion time of 3xx transactions from the origin server (0.01 ms) |
.10.34. [vhostMin] . [vhostIndex] |
http.res3xxCount | Integer | Total number of 3xx responses from the origin server |
.10.35. [vhostMin] . [vhostIndex] |
http.res3xxCompleteCount | Integer | Total number of successful 3xx transactions from the origin server |
.10.40. [vhostMin] . [vhostIndex] |
http.res4xxAverage | Integer | Number of 4xx responses from the origin server |
.10.41. [vhostMin] . [vhostIndex] |
http.res4xxCompleteAverage | Integer | Number of successful 4xx transactions from the origin server |
.10.42. [vhostMin] . [vhostIndex] |
http.res4xxTimeRes | Integer | Average elapsed time to receive a 4xx header from the origin server (0.01 ms) |
.10.43. [vhostMin] . [vhostIndex] |
http.res4xxTimeComplete | Integer | Average completion time of 4xx transactions from the origin server (0.01 ms) |
.10.44. [vhostMin] . [vhostIndex] |
http.res4xxCount | Integer | Total number of 4xx responses from the origin server |
.10.45. [vhostMin] . [vhostIndex] |
http.res4xxCompleteCount | Integer | Total number of successful 4xx transactions from the origin server |
.10.50. [vhostMin] . [vhostIndex] |
http.res5xxAverage | Integer | Number of 5xx responses from the origin server |
.10.51. [vhostMin] . [vhostIndex] |
http.res5xxCompleteAverage | Integer | Number of successful 5xx transactions from the origin server |
.10.52. [vhostMin] . [vhostIndex] |
http.res5xxTimeRes | Integer | Average elapsed time to receive a 5xx header from the origin server (0.01 ms) |
.10.53. [vhostMin] . [vhostIndex] |
http.res5xxTimeComplete | Integer | Average completion time of 5xx transactions from the origin server (0.01 ms) |
.10.54. [vhostMin] . [vhostIndex] |
http.res5xxCount | Integer | Total number of 5xx responses from the origin server |
.10.55. [vhostMin] . [vhostIndex] |
http.res5xxCompleteCount | Integer | Total number of successful 5xx transactions from the origin server |
.10.60. [vhostMin] . [vhostIndex] |
http.connectTimeoutAverage | Integer | Average number of origin server connection timeouts |
.10.61. [vhostMin] . [vhostIndex] |
http.receiveTimeoutAverage | Integer | Average number of origin server reception timeouts |
.10.62. [vhostMin] . [vhostIndex] |
http.connectAverage | Integer | Average number of origin server connection successes |
.10.63. [vhostMin] . [vhostIndex] |
http.dnsQueryTime | Integer | Average DNS query time when connecting to the origin server |
.10.64. [vhostMin] . [vhostIndex] |
http.connectTime | Integer | Origin server average connection time (0.01 ms) |
.10.65. [vhostMin] . [vhostIndex] |
http.connectTimeoutCount | Integer | Total number of origin server connection timeouts |
.10.66. [vhostMin] . [vhostIndex] |
http.receiveTimeoutCount | Integer | Total number of origin server reception timeouts |
.10.67. [vhostMin] . [vhostIndex] |
http.connectCount | Integer | Total number of origin server connection successes |
.10.68. [vhostMin] . [vhostIndex] |
http.closeAverage | Integer | Average number of sockets closed by the origin server during transmission |
.10.69. [vhostMin] . [vhostIndex] |
http.closeCount | Integer | Total number of sockets closed by the origin server during transmission |
| .11 | portbypass | OID | Port bypass origin server traffic information |
.11.1. [vhostMin] . [vhostIndex] |
portbypass.inbound | Integer | Average traffic received from the origin server via port bypass (bytes) |
.11.2. [vhostMin] . [vhostIndex] |
portbypass.outbound | Integer | Average traffic sent to the origin server via port bypass (bytes) |
.11.3. [vhostMin] . [vhostIndex] |
portbypass.sessionAverage | Integer | Average number of origin server sessions in port bypass |
.11.4. [vhostMin] . [vhostIndex] |
portbypass.closedAverage | Integer | Average number of connections closed by the origin server during port bypass |
.11.5. [vhostMin] . [vhostIndex] |
portbypass.connectTimeoutAverage | Integer | Average number of origin server connection timeouts during port bypass |
.11.6. [vhostMin] . [vhostIndex] |
portbypass.closedCount | Integer | Total number of connections closed by the origin server during port bypass |
.11.7. [vhostMin] . [vhostIndex] |
portbypass.connectTimeoutCount | Integer | Total number of origin server connection timeouts during port bypass |
cache.vhost.traffic.client
OID = 1.3.6.1.4.1.40001.1.4.3.1.11.11
Provides client traffic statistics. Client traffic is divided into HTTP traffic, SSL traffic, and port bypass traffic. SNMP does not provide statistics for each directory. Even if directory statistics are configured, the data will be accumulated before being provided.
| OID | Name | Type | Description |
|---|---|---|---|
.1. [vhostMin] . [vhostIndex] |
inbound | Integer | Average traffic received from clients (bytes) |
.2. [vhostMin] . [vhostIndex] |
outbound | Integer | Average traffic sent to clients (bytes) |
.3. [vhostMin] . [vhostIndex] |
sessionAverage | Integer | Average client session count |
.4. [vhostMin] . [vhostIndex] |
activesessionAverage | Integer | Average client transmitting session count |
| .10 | http | OID | Client HTTP traffic information |
.10.1. [vhostMin] . [vhostIndex] |
http.inbound | Integer | Average HTTP traffic received from clients (bytes) |
.10.2. [vhostMin] . [vhostIndex] |
http.outbound | Integer | Average HTTP traffic sent to clients (bytes) |
.10.3. [vhostMin] . [vhostIndex] |
http.sessionAverage | Integer | Average client HTTP session count |
.10.4. [vhostMin] . [vhostIndex] |
http.reqHeaderSize | Integer | Average HTTP Header traffic received from clients (bytes) |
.10.5. [vhostMin] . [vhostIndex] |
http.reqBodySize | Integer | Average HTTP Body traffic received from clients (bytes) |
.10.6. [vhostMin] . [vhostIndex] |
http.resHeaderSize | Integer | Average HTTP Header traffic sent to clients (bytes) |
.10.7. [vhostMin] . [vhostIndex] |
http.resBodySize | Integer | Average HTTP Body traffic sent to clients (bytes) |
.10.8. [vhostMin] . [vhostIndex] |
http.reqAverage | Integer | Average number of HTTP requests received from clients |
.10.9. [vhostMin] . [vhostIndex] |
http.reqCount | Integer | Total number of HTTP requests received from clients |
.10.10. [vhostMin] . [vhostIndex] |
http.resTotalAverage | Integer | Average number of all HTTP responses sent to clients |
.10.11. [vhostMin] . [vhostIndex] |
http.resTotalCompleteAverage | Integer | Average number of HTTP transactions completed by clients |
.10.12. [vhostMin] . [vhostIndex] |
http.resTotalTimeRes | Integer | Average elapsed time of client responses (0.01ms) |
.10.13. [vhostMin] . [vhostIndex] |
http.resTotalTimeComplete | Integer | Average elapsed time of client HTTP transactions (0.01 ms) |
.10.14. [vhostMin] . [vhostIndex] |
http.resTotalCount | Integer | Total number of all HTTP responses sent to clients |
.10.15. [vhostMin] . [vhostIndex] |
http.resTotalCompleteCount | Integer | Total number of HTTP transactions completed by clients |
.10.20. [vhostMin] . [vhostIndex] |
http.res2xxAverage | Integer | Average number of 2xx responses sent to clients |
.10.21. [vhostMin] . [vhostIndex] |
http.res2xxCompleteAverage | Integer | Average number of 2xx transactions completed by clients |
.10.22. [vhostMin] . [vhostIndex] |
http.res2xxTimeRes | Integer | Average elapsed time of client 2xx responses (0.01 ms) |
.10.23. [vhostMin] . [vhostIndex] |
http.res2xxTimeComplete | Integer | Average completion time of client 2xx transactions (0.01 ms) |
.10.24. [vhostMin] . [vhostIndex] |
http.res2xxCount | Integer | Total number of 2xx responses sent to clients |
.10.25. [vhostMin] . [vhostIndex] |
http.res2xxCompleteCount | Integer | Total number of 2xx transactions completed by clients |
.10.30. [vhostMin] . [vhostIndex] |
http.res3xxAverage | Integer | Average number of 3xx responses sent to clients |
.10.31. [vhostMin] . [vhostIndex] |
http.res3xxCompleteAverage | Integer | Average number of 3xx transactions completed by clients |
.10.32. [vhostMin] . [vhostIndex] |
http.res3xxTimeRes | Integer | Average elapsed time of client 3xx responses (0.01 ms) |
.10.33. [vhostMin] . [vhostIndex] |
http.res3xxTimeComplete | Integer | Average completion time of client 3xx transactions (0.01 ms) |
.10.34. [vhostMin] . [vhostIndex] |
http.res3xxCount | Integer | Total number of 3xx responses sent to clients |
.10.35. [vhostMin] . [vhostIndex] |
http.res3xxCompleteCount | Integer | Total number of 3xx transactions completed by clients |
.10.40. [vhostMin] . [vhostIndex] |
http.res4xxAverage | Integer | Average number of 4xx responses sent to clients |
.10.41. [vhostMin] . [vhostIndex] |
http.res4xxCompleteAverage | Integer | Average number of 4xx transactions completed by clients |
.10.42. [vhostMin] . [vhostIndex] |
http.res4xxTimeRes | Integer | Average elapsed time of client 4xx responses (0.01 ms) |
.10.43. [vhostMin] . [vhostIndex] |
http.res4xxTimeComplete | Integer | Average completion time of client 4xx transactions (0.01 ms) |
.10.44. [vhostMin] . [vhostIndex] |
http.res4xxCount | Integer | Total number of 4xx responses sent to clients |
.10.45. [vhostMin] . [vhostIndex] |
http.res4xxCompleteCount | Integer | Total number of 4xx transactions completed by clients |
.10.50. [vhostMin] . [vhostIndex] |
http.res5xxAverage | Integer | Average number of 5xx responses sent to clients |
.10.51. [vhostMin] . [vhostIndex] |
http.res5xxCompleteAverage | Integer | Average number of 5xx transactions completed by clients |
.10.52. [vhostMin] . [vhostIndex] |
http.res5xxTimeRes | Integer | Average elapsed time of client 5xx responses (0.01 ms) |
.10.53. [vhostMin] . [vhostIndex] |
http.res5xxTimeComplete | Integer | Average completion time of client 5xx transactions (0.01 ms) |
.10.54. [vhostMin] . [vhostIndex] |
http.res5xxCount | Integer | Total number of 5xx responses sent to clients |
.10.55. [vhostMin] . [vhostIndex] |
http.res5xxCompleteCount | Integer | Total number of 5xx transactions completed by clients |
.10.60. [vhostMin] . [vhostIndex] |
http.reqDeniedAverage | Integer | Average number of denied requests |
.10.61. [vhostMin] . [vhostIndex] |
http.reqDeniedCount | Integer | Total number of denied requests |
| .11 | portbypass | OID | Port bypass client traffic information |
.11.1. [vhostMin] . [vhostIndex] |
portbypass.inbound | Integer | Average traffic received from clients via port bypass (bytes) |
.11.2. [vhostMin] . [vhostIndex] |
portbypass.outbound | Integer | Average traffic sent to clients via port bypass (bytes) |
.11.3. [vhostMin] . [vhostIndex] |
portbypass.sessionAverage | Integer | Average number of client sessions in port bypass |
.11.4. [vhostMin] . [vhostIndex] |
portbypass.closedAverage | Integer | Average number of connections closed by clients during port bypass |
.11.5. [vhostMin] . [vhostIndex] |
portbypass.closedCount | Integer | Total number of connections closed by clients during port bypass |
| .12 | ssl | OID | SSL client traffic information |
.12.2. [vhostMin] . [vhostIndex] |
ssl.inbound | Integer | Average traffic received from clients via SSL (bytes) |
.12.3. [vhostMin] . [vhostIndex] |
ssl.outbound | Integer | Average traffic sent to clients via SSL (bytes) |
| .13 | requestHitAverage | OID | Average number of cache HIT results |
.13.1. [vhostMin] . [vhostIndex] |
requestHitAverage.TCP_HIT | Integer | TCP_HIT |
.13.2. [vhostMin] . [vhostIndex] |
requestHitAverage.TCP_IMS_HIT | Integer | TCP_IMS_HIT |
.13.3. [vhostMin] . [vhostIndex] |
requestHitAverage.TCP_REFRESH_HIT | Integer | TCP_REFRESH_HIT |
.13.4. [vhostMin] . [vhostIndex] |
requestHitAverage.TCP_REF_FAIL_HIT | Integer | TCP_REF_FAIL_HIT |
.13.5. [vhostMin] . [vhostIndex] |
requestHitAverage.TCP_NEGATIVE_HIT | Integer | TCP_NEGATIVE_HIT |
.13.6. [vhostMin] . [vhostIndex] |
requestHitAverage.TCP_MISS | Integer | TCP_MISS |
.13.7. [vhostMin] . [vhostIndex] |
requestHitAverage.TCP_REFRESH_MISS | Integer | TCP_REFRESH_MISS |
.13.8. [vhostMin] . [vhostIndex] |
requestHitAverage.TCP_CLIENT_REFRESH_MISS | Integer | TCP_CLIENT_REFRESH_MISS |
.13.9. [vhostMin] . [vhostIndex] |
requestHitAverage.TCP_DENIED | Integer | TCP_DENIED |
.13.10. [vhostMin] . [vhostIndex] |
requestHitAverage.TCP_ERROR | Integer | TCP_ERROR |
.13.11. [vhostMin] . [vhostIndex] |
requestHitAverage.TCP_REDIRECT_HIT | Integer | TCP_REDIRECT_HIT |
| .14 | requestHitCount | OID | Total number of cache HIT results |
.14.1. [vhostMin] . [vhostIndex] |
requestHitCount.TCP_HIT | Integer | TCP_HIT |
.14.2. [vhostMin] . [vhostIndex] |
requestHitCount.TCP_IMS_HIT | Integer | TCP_IMS_HIT |
.14.3. [vhostMin] . [vhostIndex] |
requestHitCount.TCP_REFRESH_HIT | Integer | TCP_REFRESH_HIT |
.14.4. [vhostMin] . [vhostIndex] |
requestHitCount.TCP_REF_FAIL_HIT | Integer | TCP_REF_FAIL_HIT |
.14.5. [vhostMin] . [vhostIndex] |
requestHitCount.TCP_NEGATIVE_HIT | Integer | TCP_NEGATIVE_HIT |
.14.6. [vhostMin] . [vhostIndex] |
requestHitCount.TCP_MISS | Integer | TCP_MISS |
.14.7. [vhostMin] . [vhostIndex] |
requestHitCount.TCP_REFRESH_MISS | Integer | TCP_REFRESH_MISS |
.14.8. [vhostMin] . [vhostIndex] |
requestHitCount.TCP_CLIENT_REFRESH_MISS | Integer | TCP_CLIENT_REFRESH_MISS |
.14.9. [vhostMin] . [vhostIndex] |
requestHitCount.TCP_DENIED | Integer | TCP_DENIED |
.14.10. [vhostMin] . [vhostIndex] |
requestHitCount.TCP_ERROR | Integer | TCP_ERROR |
.14.11. [vhostMin] . [vhostIndex] |
requestHitCount.TCP_REDIRECT_HIT | Integer | TCP_REDIRECT_HIT |
cache.vhost.traffic.filesystem
OID = 1.3.6.1.4.1.40001.1.4.3.1.11.20
Provides File I/O statistics of a virtual host.
| OID | Name | Type | Description |
|---|---|---|---|
.1. [vhostMin] . [vhostIndex] |
requestHitRatio | Integer | Request Hit Ratio (100%) |
.2. [vhostMin] . [vhostIndex] |
Request Hit Ratio (10000%) | ||
.3. [vhostMin] . [vhostIndex] |
byteHitRatio | Integer | Byte Hit Ratio (100%) |
.4. [vhostMin] . [vhostIndex] |
Byte Hit Ratio (10000%) | ||
.5. [vhostMin] . [vhostIndex] |
outbound | Integer | Average traffic sent to File I/O (bytes) |
.6. [vhostMin] . [vhostIndex] |
session | Integer | Average number of threads in File I/O |
| .7 | requestHitAverage | OID | Average number of cache HIT results |
.7.1. [vhostMin] . [vhostIndex] |
requestHitAverage.TCP_HIT | Integer | TCP_HIT |
.7.2. [vhostMin] . [vhostIndex] |
requestHitAverage.TCP_IMS_HIT | Integer | TCP_IMS_HIT |
.7.3. [vhostMin] . [vhostIndex] |
requestHitAverage.TCP_REFRESH_HIT | Integer | TCP_REFRESH_HIT |
.7.4. [vhostMin] . [vhostIndex] |
requestHitAverage.TCP_REF_FAIL_HIT | Integer | TCP_REF_FAIL_HIT |
.7.5. [vhostMin] . [vhostIndex] |
requestHitAverage.TCP_NEGATIVE_HIT | Integer | TCP_NEGATIVE_HIT |
.7.6. [vhostMin] . [vhostIndex] |
requestHitAverage.TCP_MISS | Integer | TCP_MISS |
.7.7. [vhostMin] . [vhostIndex] |
requestHitAverage.TCP_REFRESH_MISS | Integer | TCP_REFRESH_MISS |
.7.8. [vhostMin] . [vhostIndex] |
requestHitAverage.TCP_CLIENT_REFRESH_MISS | Integer | TCP_CLIENT_REFRESH_MISS |
.7.9. [vhostMin] . [vhostIndex] |
requestHitAverage.TCP_DENIED | Integer | TCP_DENIED |
.7.10. [vhostMin] . [vhostIndex] |
requestHitAverage.TCP_ERROR | Integer | TCP_ERROR |
.7.11. [vhostMin] . [vhostIndex] |
requestHitAverage.TCP_REDIRECT_HIT | Integer | TCP_REDIRECT_HIT |
| .8 | requestHitCount | OID | Total number of cache HIT results |
.8.1. [vhostMin] . [vhostIndex] |
requestHitCount.TCP_HIT | Integer | TCP_HIT |
.8.2. [vhostMin] . [vhostIndex] |
requestHitCount.TCP_IMS_HIT | Integer | TCP_IMS_HIT |
.8.3. [vhostMin] . [vhostIndex] |
requestHitCount.TCP_REFRESH_HIT | Integer | TCP_REFRESH_HIT |
.8.4. [vhostMin] . [vhostIndex] |
requestHitCount.TCP_REF_FAIL_HIT | Integer | TCP_REF_FAIL_HIT |
.8.5. [vhostMin] . [vhostIndex] |
requestHitCount.TCP_NEGATIVE_HIT | Integer | TCP_NEGATIVE_HIT |
.8.6. [vhostMin] . [vhostIndex] |
requestHitCount.TCP_MISS | Integer | TCP_MISS |
.8.7. [vhostMin] . [vhostIndex] |
requestHitCount.TCP_REFRESH_MISS | Integer | TCP_REFRESH_MISS |
.8.8. [vhostMin] . [vhostIndex] |
requestHitCount.TCP_CLIENT_REFRESH_MISS | Integer | TCP_CLIENT_REFRESH_MISS |
.8.9. [vhostMin] . [vhostIndex] |
requestHitCount.TCP_DENIED | Integer | TCP_DENIED |
.8.10. [vhostMin] . [vhostIndex] |
requestHitCount.TCP_ERROR | Integer | TCP_ERROR |
.8.11. [vhostMin] . [vhostIndex] |
requestHitCount.TCP_REDIRECT_HIT | Integer | TCP_REDIRECT_HIT |
.10. [vhostMin] . [vhostIndex] |
getattr.filecount | Integer | (getattr function call) Number of FILE responses |
.11. [vhostMin] . [vhostIndex] |
getattr.dircount | Integer | (getattr function call) Number of DIR responses |
.12. [vhostMin] . [vhostIndex] |
getattr.failcount | Integer | (getattr function call) Number of failure responses |
.13. [vhostMin] . [vhostIndex] |
getattr.timeres | Integer | (getattr function call) Response time (0.01 ms) |
.14. [vhostMin] . [vhostIndex] |
open.count | Integer | Number of open function calls |
.15. [vhostMin] . [vhostIndex] |
open.timeres | Integer | Response time of the open function (0.01 ms) |
.16. [vhostMin] . [vhostIndex] |
read.count | Integer | Number of read function calls |
.17. [vhostMin] . [vhostIndex] |
read.timeres | Integer | Response time of the read function (0.01 ms) |
.18. [vhostMin] . [vhostIndex] |
read.buffersize | Integer | Size of the buffer requested by the read function (bytes) |
.19. [vhostMin] . [vhostIndex] |
read.bufferfilled | Integer | Size of filled space in the buffer requested by the read function (bytes) |
cache.vhost.traffic.dims
OID = 1.3.6.1.4.1.40001.1.4.3.1.11.21
Provides DIMS conversion statistics of a virtual host.
| OID | Name | Type | Description |
|---|---|---|---|
.1. [vhostMin] . [vhostIndex] |
requests | Integer | Number of DIMS conversion requests |
.2. [vhostMin] . [vhostIndex] |
converted | Integer | Number of conversion successes |
.3. [vhostMin] . [vhostIndex] |
failed | Integer | Number of conversion failures |
.4. [vhostMin] . [vhostIndex] |
avgsrcsize | Integer | Average size of origin images (bytes) |
.5. [vhostMin] . [vhostIndex] |
avgdestsize | Integer | Average size of converted images (bytes) |
.6. [vhostMin] . [vhostIndex] |
avgtime | Integer | Conversion time (ms) |
cache.vhost.traffic.compression
OID = 1.3.6.1.4.1.40001.1.4.3.1.11.22
Provides compression statistics of a virtual host.
| OID | Name | Type | Description |
|---|---|---|---|
.1. [vhostMin] . [vhostIndex] |
requests | Integer | Number of compression requests |
.2. [vhostMin] . [vhostIndex] |
converted | Integer | Number of compression successes |
.3. [vhostMin] . [vhostIndex] |
failed | Integer | Number of compression failures |
.4. [vhostMin] . [vhostIndex] |
avgsrcsize | Integer | Average size of origin files (bytes) |
.5. [vhostMin] . [vhostIndex] |
avgdestsize | Integer | Average size of compressed files (bytes) |
.6. [vhostMin] . [vhostIndex] |
avgtime | Integer | Compression time (ms) |
cache.view
OID = 1.3.6.1.4.1.40001.1.4.11.1
Provides information identical to the virtual host statistics. [viewIndex] starts at 1 and ranges up to the number of Views.
- 1.3.6.1.4.1.40001.1.4.3 - Virtual host statistics
- 1.3.6.1.4.1.40001.1.4.11 - View statistics