Chapter 10. Monitoring & Statistics
This chapter will cover monitoring and statistics. While monitoring and statistics can be interpreted differently based on how they are used, they are similar in that they both use numbers to describe the system.
The most important feature is that it updates in real time. It is important to be able to view real-time status updates, and even a five-minute delay is too long. It is also important to know if the many policies are taking effect when they are applied. All statistics are collected every second.
Statistics are collected for each virtual host and are provided in real time (every second), with an average being provided every five minutes. The results are provided in JSON and XML formats for the users to analyze and process the results easily.
http://127.0.0.1:10040/monitoring/realtime?type=[JSON or XML]
http://127.0.0.1:10040/monitoring/average?type=[JSON or XML]
realtimeDisplays the service status from one second ago.averageDisplays the average of five minutes of statistics.
Data Range
The range of data to be collected can be configured.
# server.xml - <Server><VHostDefault>
# vhosts.xml - <Vhosts><Vhost>

<Stats>
   <DirDepth>0</DirDepth>
   <DirDepthAccum>OFF</DirDepthAccum>
   <HttpsTraffic>OFF</HttpsTraffic>
   <ClientLocal>OFF</ClientLocal>
   <OriginLocal>OFF</OriginLocal>
</Stats>
<DirDepth> (default: 0)Collects statistics for each directory. If set to zero, statistics will be collected in the root (/) directory. If set to one, statistics will be collected in directories one level down.
Note
Though there is no limit to the value that can be set, collecting statistics for too many directories can cause memory problems.
<DirDepthAccum>Configures whether or not to accumulate statistics in the parent directory when collecting the statistics for each directory. If
<DirDepth>is set to zero, this setting is ignored.OFF (default)Statistics are not accumulated in the parent directory.ONStatistics are accumulated in the parent directory.
For example, let’s assume that
<DirDepth>is set to two and all directories have ten lines of traffic. If<DirDepthAccum>is set toOFF, then statistics will be collected in each directory where traffic occurs, as shown in the left diagram. If set toON, statistics from lower directories are accumulated in parent directories, as shown in the right diagram.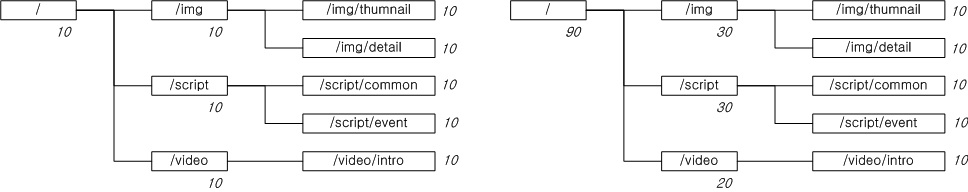
Accumulated statistics in the parent directory.
In this example, the sum of the traffic in the /img directory and its subdirectories is 30, which is accumulated into the parent directory.
<HttpsTraffic>OFF (default)HTTPS traffic is only collected in SSL statistics.ONHTTPS traffic is collected into both SSL and HTTP statistics.
Generally, traffic that passes through the SSL layer is stored separately as SSL statistics. However, HTTPS will be processed as HTTP in upper protocols, so more detailed statistics can be collected. Because SSL and HTTP statistics can overlap, it is recommended to only trust HTTP statistics.
<ClientLocal>The traffic between the Loopback client and STON can be included in statistics.
OFF (default)Will not be included.ONWill be included.
<OriginLocal>The traffic between STON and the Loopback origin server will be included.
OFF (default)Will not be included.ONWill be included.
Host Aggregate Statistics
Host statistics are the aggregate statistics of all the virtual hosts that run on the lowest level. The statistics can be provided in JSON and XML formats.
{                                            <Host
  "Host":                                      Version="2.0.0"
  {                                            Name="localhost"
    "Version":"2.0.0",                         State="Healthy"
    "Name":"localhost",                        Uptime="155986"
    "State":"Healthy",                         OriginSession="32"
    "Uptime":155996,                           OriginActiveSession="20"
    "OriginSession":33,                        OriginInbound="1140741"
    "OriginActiveSession":20,                  OriginOutbound="10059"
    "OriginInbound":688177,                    OriginReqCount="42"
    "OriginOutbound":14184,                    OriginResTotalCount="42"
    "OriginReqCount":62,                       OriginResTotalTimeRes="5071"
    "OriginResTotalCount":62,                  OriginResTotalTimeComplete="10288"
    "OriginResTotalTimeRes":2375,              OriginRes2xxCount="19"
    "OriginResTotalTimeComplete":2509,         OriginRes2xxTimeRes="9989"
    "OriginRes2xxCount":54,                    OriginRes2xxTimeComplete="21521"
    "OriginRes2xxTimeRes":2327,                OriginRes3xxCount="23"
    "OriginRes2xxTimeComplete":2481,           OriginRes3xxTimeRes="1008"
    "OriginRes3xxCount":8,                     OriginRes3xxTimeComplete="1008"
    "OriginRes3xxTimeRes":2700,                OriginRes4xxCount="0"
    "OriginRes3xxTimeComplete":2700,           OriginRes4xxTimeRes="0"
    "OriginRes4xxCount":0,                     OriginRes4xxTimeComplete="0"
    "OriginRes4xxTimeRes":0,                   OriginRes5xxCount="0"
    "OriginRes4xxTimeComplete":0,              OriginRes5xxTimeRes="0"
    "OriginRes5xxCount":0,                     OriginRes5xxTimeComplete="0"
    "OriginRes5xxTimeRes":0,                   ClientSession="165"
    "OriginRes5xxTimeComplete":0,              ClientActiveSession="80"
    "ClientSession":155,                       ClientInbound="14792"
    "ClientActiveSession":80                   ClientOutbound="1981700"
    "ClientInbound":35748,                     ClientReqCount="64"
    "ClientOutbound":972906,                   ClientResTotalCount="64"
    "ClientReqCount":152,                      ClientResTotalTimeRes="5535"
    "ClientResTotalCount":152,                 ClientResTotalTimeComplete="6840"
    "ClientResTotalTimeRes":1411,              ClientRes2xxCount="44"
    "ClientResTotalTimeComplete":1479,         ClientRes2xxTimeRes="8050"
    "ClientRes2xxCount":93,                    ClientRes2xxTimeComplete="9943"
    "ClientRes2xxTimeRes":2305,                ClientRes3xxCount="20"
    "ClientRes2xxTimeComplete":2409,           ClientRes3xxTimeRes="5"
    "ClientRes3xxCount":59,                    ClientRes3xxTimeComplete="15"
    "ClientRes3xxTimeRes":3,                   ClientRes4xxCount="0"
    "ClientRes3xxTimeComplete":13,             ClientRes4xxTimeRes="0"
    "ClientRes4xxCount":0,                     ClientRes4xxTimeComplete="0"
    "ClientRes4xxTimeRes":0,                   ClientRes5xxCount="0"
    "ClientRes4xxTimeComplete":0,              ClientRes5xxTimeRes="0"
    "ClientRes5xxCount":0,                     ClientRes5xxTimeComplete="0"
    "ClientRes5xxTimeRes":0,                   RequestHitRatio="6923"
    "ClientRes5xxTimeComplete":0,              ByteHitRatio="4243">
    "RequestHitRatio":6387,                    <HttpCountSum
    "ByteHitRatio":2926,                         OriginReqCount="0"
    "HttpCountSum" :                             OriginResTotalCount="0"
    {                                            OriginRes2xxCount="0"
      "OriginReqCount" : 0,                      OriginRes3xxCount="0"
      "OriginResTotalCount" : 0,                 OriginRes4xxCount="0"
      "OriginRes2xxCount" : 0,                   OriginRes5xxCount="0"
      "OriginRes3xxCount" : 0,                   ClientReqCount="0"
      "OriginRes4xxCount" : 0,                   ClientResTotalCount="0"
      "OriginRes5xxCount" : 0,                   ClientRes2xxCount="0"
      "ClientReqCount" : 0,                      ClientRes3xxCount="0"
      "ClientResTotalCount" : 0,                 ClientRes4xxCount="0"
      "ClientRes2xxCount" : 0,                   ClientRes5xxCount="0"/>
      "ClientRes3xxCount" : 0,                 <HttpRequestHitSum
      "ClientRes4xxCount" : 0,                   TCP_NONE="0"
      "ClientRes5xxCount" : 0                    TCP_HIT="0"
    },                                           TCP_IMS_HIT="0"
    "HttpRequestHitSum" :                        TCP_REFRESH_HIT="0"
    {                                            TCP_REF_FAIL_HIT="0"
      "TCP_NONE" : 0,                            TCP_NEGATIVE_HIT="0"
      "TCP_HIT" : 0,                             TCP_REDIRECT_HIT="0"
      "TCP_IMS_HIT" : 0,                         TCP_MISS="0"
      "TCP_REFRESH_HIT" : 0,                     TCP_REFRESH_MISS="0"
      "TCP_REF_FAIL_HIT" : 0,                    TCP_CLIENT_REFRESH_MISS="0"
      "TCP_NEGATIVE_HIT" : 0,                    TCP_DENIED="0"
      "TCP_REDIRECT_HIT" : 0,                    TCP_ERROR="0"/>
      "TCP_MISS" : 0,                          <FileSystem>
      "TCP_REFRESH_MISS" : 0,                    <RequestHitRatio>0</RequestHitRatio>
      "TCP_CLIENT_REFRESH_MISS" : 0,             <ByteHitRatio>0</ByteHitRatio>
      "TCP_DENIED" : 0,                          <Outbound>0</Outbound>
      "TCP_ERROR" : 0                            <Session>0</Session>
    },                                         </FileSystem>
    "FileSystem":                              <System> ... </System>
    {                                          <VirtualHost> ... </VirtualHost>
      "RequestHitRatio":0,                     <VirtualHost> ... </VirtualHost>
      "ByteHitRatio":0,                        <VirtualHost> ... </VirtualHost>
      "Outbound":0,                            <View> ... </View>
      "Session":0                              <View> ... </View>
    },                                       </Host>
    "System":{ ... },
    "VirtualHost": [ ... ]
    "View": [ ... ]
  }
}
VersionSTON version.NameThe host name. If not defined, the system name will be used.StateService status. (Healthy=Normal service, Inactive=Inactive license, Emergency)Uptime (unit: seconds)The service running time.OriginSessionThe number of origin sessions.OriginActiveSessionThe number of transmitting origin sessions.OriginInbound (unit: bytes, average)The amount of data received from the origin server.OriginReqCount (average)The amount of requests to the origin server.OriginOutbound (unit: bytes, average)The amount of data transmitted to the origin server.OriginResTotalCount (average)The number of responses from the origin server.OriginResTotalTimeRes (unit: 0.01 ms, average)The origin server response time (from HTTP request to first HTTP response).OriginResTotalTimeComplete (unit: 0.01 ms, average)The origin server HTTP transaction completion time (from HTTP request to HTTP response completion).OriginRes2xxCount (average)The number of 2xx responses from the origin server.OriginRes2xxTimeRes (unit: 0.01 ms, average)The origin server 2xx response time.OriginRes2xxTimeComplete (unit: 0.01 ms, average)The origin server 2xx transaction completion time.OriginRes3xxCount (average)The number of 3xx responses from the origin server.OriginRes3xxTimeRes (unit: 0.01 ms, average)The origin server 3xx response time.OriginRes3xxTimeComplete (unit: 0.01ms, average)The origin server 3xx transaction completion time.OriginRes4xxCount (average)The number of 4xx responses from the origin server.OriginRes4xxTimeRes (unit: 0.01 ms, average)The origin server 4xx response time.OriginRes4xxTimeComplete (unit: 0.01ms, average)The origin server 4xx transaction completion time.OriginRes5xxCount (average)The number of 5xx responses from the origin server.OriginRes5xxTimeRes (unit: 0.01 ms, average)The origin server 5xx response time.OriginRes5xxTimeComplete (unit: 0.01 ms, average)The origin server 5xx transaction completion time.ClientSessionThe number of client sessions.ClientActiveSessionThe number of transmitting client sessions.ClientInbound (unit: bytes, average)The amount of inbound data from clients.ClientOutbound (unit: bytes, average)The amount of outbound data to clients.ClientReqCount (average)The number of client requests.ClientResTotalCount (average)The number of client responses.ClientResTotalTimeRes (unit: 0.01 ms, average)The client response time (from HTTP request to first HTTP response).ClientResTotalTimeComplete (unit: 0.01 ms, average)The client HTTP transaction completion time (from HTTP request to HTTP response completion).ClientRes2xxCount (average)The number of 2xx responses from the client.ClientRes2xxTimeRes (unit: 0.01 ms, average)The client 2xx response time.ClientRes2xxTimeComplete (unit: 0.01 ms, average)The client 2xx transaction completion time.ClientRes3xxCount (average)The number of 3xx responses from the client.ClientRes3xxTimeRes (unit: 0.01 ms, average)The client 3xx response time.ClientRes3xxTimeComplete (unit: 0.01 ms, average)The client 3xx transaction completion time.ClientRes4xxCount (average)The number of 4xx responses from the client.ClientRes4xxTimeRes (unit: 0.01 ms, average)The client 4xx response time.ClientRes4xxTimeComplete (unit: 0.01 ms, average)The client 4xx transaction completion time.ClientRes5xxCount (average)The number of 5xx responses from the client.ClientRes5xxTimeRes (unit: 0.01 ms, average)The client 5xx response time.ClientRes5xxTimeComplete (unit: 0.01 ms, average)The client 5xx transaction completion time.RequestHitRatio (unit: 0.01%, average)Hit ratio. If a caching object is created and the corresponding object is initialized, it is considered a hit. On the other hand, if the caching object is missing or the object is not initialized from the origin server, it does not count as a hit. The response code is unrelated to the hit ratio.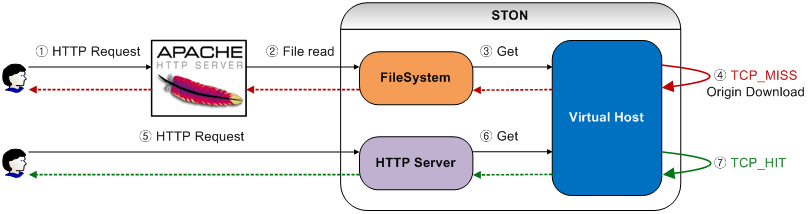
HTTP and File I/O share the virtual host.
The RequestHitRatio of File I/O accessed via Apache will become 0%. The HTTP server, however, accesses cached files due to File I/O, making the RequestHitRatio 100%. ByteHitRatio is calculated as the ratio of the origin inbound to either HTTP outbound or File I/O outbound.
ByteHitRatio (unit: 0.01%, average)The transfer ratio of the origin server to the client.(Client Outbound - Origin Server Inbound) / Client Outbound
If the origin server is much faster or the client session closes quickly, then the total ratio can become a negative value.
FileSystemIndependent FileSystem statistics that do not count other stat values.RequestHitRatio (unit: 0.01%, average)Hit ratio based on File I/O.ByteHitRatio (unit: 0.01%, average)Transfer ratio of origin server to File I/O.Outbound (unit: bytes, average)Size of data that goes through File I/O.Session (average)The number of threads in the File I/O process.
Note
These statistics are only provided in five-minute increments.
HttpCountSumThe total number of HTTP transactions.HttpRequestHitSumThe cache hit results.
System Statistics
The statistics of the system and global resources can be provided in JSON and XML formats.
"System":                                   <System>
{                                             <CPU
  "CPU":                                          Kernel="689"
  {                                               User="1316"
    "Kernel":689,                                 Idle="7993"
    "User":1316,                                  ProcKernel="570"
    "Idle":7993,                                  ProcUser="1216"
    "ProcKernel":570,                             Nice="0"
    "ProcUser":1216,                              IOWait="52"
    "Nice":0,                                     IRQ="10"
    "IOWait":52,                                  SoftIRQ="12"
    "IRQ":10,                                     Steal="0" />
    "SoftIRQ":12,                             <Mem Free="5914644" STON="9785800"/>
    "Steal":0                                 <Storage>
  },                                            <Disk
  "Mem":                                            Path="/cache1"
  {                                                 Status="Normal"
    "Free":5914644,                                 Read="23"
    "STON":9785800                                  ReadMerged="0"
  },                                                ReadSectors="344"
  "Storage":                                        ReadTime="117"
  {                                                 Write="24"
    "Disk":                                         WriteMerged="93"
    [                                               WriteSectors="936"
      {                                             WriteTime="256"
        "Path":"/cache1",                           IOProgress="0"
        "Status":"Normal",                          IOTime="173"
        "Read":23,                                  IOWeightedTime="373"/>
        "ReadMerged":0,                         <Disk
        "ReadSectors":344,                          Path="/cache2"
        "ReadTime":117,                             Status="Normal"
        "Write":24,                                 Read="27"
        "WriteMerged":93,                           ReadMerged="1"
        "WriteSectors":936,                         ReadSectors="488"
        "WriteTime":256,                            ReadTime="144"
        "IOProgress":0,                             Write="24"
        "IOTime":173,                               WriteMerged="86"
        "IOWeightedTime":373                        WriteSectors="880"
      },                                            WriteTime="254"
      {                                             IOProgress="0"
        "Path":"/cache2",                           IOTime="189"
        "Status":"Normal",                          IOWeightedTime="380"/>
        "Read":27,                            </Storage>
        "ReadMerged":1,                       <ServerSocket
        "ReadSectors":488,                          Total="42"
        "ReadTime":144,                             Established="2"
        "Write":24,                                 Accepted="1"
        "WriteMerged":86,                           Closed="0"/>
        "WriteSectors":880,                   <ClientSocket
        "WriteTime":254,                            Total="1"
        "IOProgress":0,                             Established="0"
        "IOTime":189,                               Connected="0"
        "IOWeightedTime":380                        Closed="0"/>
      }                                       <TCPSocket
    ]                                               Established="30"
  },                                                Timewait="2"
  "ServerSocket":                                   Orphan="0"
  {                                                 Alloc="0"
    "Total":42,                                     Mem="20"/>
    "Established":1,                          <EQ>0</EQ>
    "Accepted":0,                             <RQ>1000000</RQ>
    "Closed":0                                <WaitingFiles2Write>0</WaitingFiles2Write>
  },                                          <ServiceAccess Allow="60" Deny="2"/>
  "ClientSocket":                             <SystemLoadAverage Min1="0" Min5="0" Min15="0"/>
  {                                           <URLRewrite>57</URLRewrite>
    "Total":1,                              </System>
    "Established":0,
    "Connected":0,
    "Closed":0
  },
  "TCPSocket":
  {
    "Established":30,
    "Timewait":2,
    "Orphan":0,
    "Alloc":0,
    "Mem":20
  },
  "EQ":0,
  "RQ":1000000,
  "WaitingFiles2Write":0,
  "ServiceAccess":{"Allow":60, "Deny":2}
  "SystemLoadAverage":
  {
    "Min1":0,
    "Min5":0,
    "Min15":0
  },
  "URLRewrite":57
}
CPU (unit: 0.01%)CPU usage. Total CPU usage can be calculated by Kernel + User.KernelCPU (Kernel) usage.UserCPU (User) usage.IdleIdle CPU.ProcKernelCPU (Kernel) usage by STON.ProcUserCPU (User) usage by STON.NiceTime spent running ‘niced’ user processes.IOWaitTime spent waiting for I/O to complete.IRQTime spent servicing interrupts.SoftIRQTime spent servicing software interrupts.StealTime spent while other CPUs are serviced.
Mem (unit: bytes)Memory usage.FreeSize of free memory in the system.STONSize of memory used by STON.
DiskDisk performance stats.PathDisk path.StatusDisk status (Normal: normal, Invalid: excluded due to failure, Unmounted: unmounted by administrator).ReadThe number of successful reads.ReadMergedThe number of merged reads.ReadSectorsThe number of read sectors.ReadTime (unit: ms)The elapsed time per read.WriteThe number of successful writes.WriteMergedThe number of merged writes.WriteSectorsThe number of written sectors.WriteTime (unit: ms)The elapsed time per write.IOProgressThe number of running I/Os.IOTime (unit: ms)The elapsed time per I/O.IOWeightedTime (unit: ms)The elapsed time per I/O (weight applied).
ServerSocketServer socket (between client and STON) information.TotalThe total number of server sockets.EstablishedThe number of connected server sockets.AcceptedThe number of newly connected server sockets.ClosedThe number of closed server sockets.
ClientSocketClient socket (between STON and the origin server) information.TotalThe total number of client sockets.EstablishedThe number of connected client sockets.ConnectedThe number of newly connected client sockets.ClosedThe number of closed client sockets.
TCPSocketTCP status information provided by the system (OS).EstablishedThe number of established status TCP connections.TimewaitThe number of TIME_WAIT status TCP connections.OrphanThe number of orphaned TCP connections (not attached to a file handle).AllocThe number of allocated TCP sockets.MemThe amount of memory used by TCP sockets.
EQThe number of unprocessed events in the STON Framework.RQThe number of events saved in the recently serviced content reference queue.WaitingFiles2WriteThe number of disk write pending files.ServiceAccessThe number of sockets allowed and denied by ServiceAccess.SystemLoadAverageThe 1/5/15 minute average of the System Load Average.URLRewriteThe number of successful conversions made by the URL preprocessor.
Virtual Host Statistics
Statistics are provided for each virtual host. There are four types of virtual host statistics: HTTP transfer (per directory), URL bypass, port bypass, and SSL.
"VirtualHost":                               <VirtualHost
[                                                Name="image.11st.co.kr"
  {                                              Uptime="155956"
    "Name":"image.11st.co.kr",                   OriginSession="12"
    "Uptime":155966,                             OriginActiveSession="6"
    "OriginSession":12,                          OriginInbound="106914"
    "OriginActiveSession":6,                     OriginOutbound="3238"
    "OriginInbound":169,                         OriginReqCount="42"
    "OriginOutbound":269,                        OriginResTotalCount="13"
    "OriginReqCount":62,                         OriginResTotalTimeRes="1553"
    "OriginResTotalCount":1,                     OriginResTotalTimeComplete="6630"
    "OriginResTotalTimeRes":3300,                OriginRes2xxCount="1"
    "OriginResTotalTimeComplete":3300,           OriginRes2xxTimeRes="3300"
    "OriginRes2xxCount":0,                       OriginRes2xxTimeComplete="69300"
    "OriginRes2xxTimeRes":0,                     OriginRes3xxCount="12"
    "OriginRes2xxTimeComplete":0,                OriginRes3xxTimeRes="1408"
    "OriginRes3xxCount":1,                       OriginRes3xxTimeComplete="1408"
    "OriginRes3xxTimeRes":3300,                  OriginRes4xxCount="0"
    "OriginRes3xxTimeComplete":3300,             OriginRes4xxTimeRes="0"
    "OriginRes4xxCount":0,                       OriginRes4xxTimeComplete="0"
    "OriginRes4xxTimeRes":0,                     OriginRes5xxCount="0"
    "OriginRes4xxTimeComplete":0,                OriginRes5xxTimeRes="0"
    "OriginRes5xxCount":0,                       OriginRes5xxTimeComplete="0"
    "OriginRes5xxTimeRes":0,                     ClientSession="30"
    "OriginRes5xxTimeComplete":0,                ClientActiveSession="12"
    "ClientSession":26,                          ClientInbound="4113"
    "ClientActiveSession":16,                    ClientOutbound="895937"
    "ClientInbound":13968,                       ClientReqCount="64"
    "ClientOutbound":110398,                     ClientResTotalCount="18"
    "ClientReqCount":152,                        ClientResTotalTimeRes="666"
    "ClientResTotalCount":52,                    ClientResTotalTimeComplete="4377"
    "ClientResTotalTimeRes":94,                  ClientRes2xxCount="10"
    "ClientResTotalTimeComplete":107,            ClientRes2xxTimeRes="1200"
    "ClientRes2xxCount":1,                       ClientRes2xxTimeComplete="7870"
    "ClientRes2xxTimeRes":4700,                  ClientRes3xxCount="8"
    "ClientRes2xxTimeComplete":4800,             ClientRes3xxTimeRes="0"
    "ClientRes3xxCount":51,                      ClientRes3xxTimeComplete="12"
    "ClientRes3xxTimeRes":3,                     ClientRes4xxCount="0"
    "ClientRes3xxTimeComplete":15,               ClientRes4xxTimeRes="0"
    "ClientRes4xxCount":0,                       ClientRes4xxTimeComplete="0"
    "ClientRes4xxTimeRes":0,                     ClientRes5xxCount="0"
    "ClientRes4xxTimeComplete":0,                ClientRes5xxTimeRes="0"
    "ClientRes5xxCount":0,                       ClientRes5xxTimeComplete="0"
    "ClientRes5xxTimeRes":0,                     RequestHitRatio="10000"
    "ClientRes5xxTimeComplete":0,                ByteHitRatio="8806">
    "RequestHitRatio":10000,                   <FileSystem>
    "ByteHitRatio":9984,                         <RequestHitRatio>0</RequestHitRatio>
    "FileSystem":                                <ByteHitRatio>0</ByteHitRatio>
    {                                            <Outbound>0</Outbound>
      "RequestHitRatio":0,                       <Session>0</Session>
      "ByteHitRatio":0,                        </FileSystem>
      "Outbound":0,                            <Memory>784786700</Memory>.
      "Session":0                              <SecuredMemory>0</SecuredMemory>.
    },                                         <Disk> ... </Disk>
    "Memory":785740769,                        <Session> ... </Session>
    "SecuredMemory":0,                         <Dims> ... </Dims>
    "Disk": { ... },                           <Compression> ... </Compression>
    "Session": { ... },                        <File Total="458278" Opened="15" Instance="458292"/>
    "Dims": { ... },                           <Cached> ... </Cached>
    "Compression": { ... },                    <CacheFileEvent> ... </CacheFileEvent>
    "FileTotal":458308,                        <WaitingFiles2Delete>1087593</WaitingFiles2Delete>
    "FileOpened":15,                           <CacheFileEvent Create=\"%u\" Swap=\"%u\" Erase=\"%u\" Purge=\"%u\" Expire=\"%u\" />
    "FileInstance":458320,                     <ClientHttpReqBypass Sum="8100">27</ClientHttpReqBypass>
    "Cached": { ... },                         <ClientHttpReqDenied Sum="400">1</ClientHttpReqDenied>
    "CacheFileEvent": { ... },                 <OriginTraffic> ... </OriginTraffic>
    "WaitingFiles2Delete":1087595,             <PortBypass> ... </PortBypass>
    "ClientHttpReqBypassSum":8100,             <ClientTraffic> ... </ClientTraffic>
    "ClientHttpReqBypass":27,                  <UrlBypass> ... </UrlBypass>
    "ClientHttpReqDeniedSum":400,            </VirtualHost>
    "ClientHttpReqDenied":1,                 <VirtualHost> ... </VirtualHost>
    "OriginTraffic": { ... },                <VirtualHost> ... </VirtualHost>
    "PortBypass": { ... },                   <VirtualHost> ... </VirtualHost>
    "ClientTraffic": { ... },
    "UrlBypass": { ... }

  },
  ...
]
Note
The values will be the same as host statistics from Name to FileSystem.
Memory (unit: bytes)The amount of content loaded into memory.SecuredMemory (unit: bytes)The amount of content deleted from memory.DiskDisk information.SessionSession information.DimsDIMS conversion statistics.CompressionCompression statistics.FileTotalThe total number of files.FileOpenedThe number of opened local files.FileInstanceThe number of caching files.CachedCaching information.CacheFileEventA caching file event.WaitingFiles2DeleteThe number of files pending deletion.ClientHttpReqBypassThe number of bypassed client HTTP requests.ClientHttpReqDeniedThe number of denied HTTP requests.OriginTrafficOrigin server traffic statistics.PortBypassPort bypass traffic statistics.ClientTrafficClient traffic statistics.UrlBypassHTTP traffic statistics bypassed to the origin server via URL matching or<BypassNoCacheRequest>.
Note
These statistics are only provided in five-minute increments.
ClientHttpReqBypassSumThe total number of bypassed HTTP requests.ClientHttpReqDeniedSumThe total number of denied HTTP requests.
Disk Statistics
Provides disk statistics used by virtual hosts.
"Disk":                                      <Disk>
{                                              <TotalSize>22003701435</TotalSize>
  "TotalSize":22004057982,                     <Create>1</Create>
  "Create":0,                                  <Open>10</Open>
  "Open":1,                                    <Delete>0</Delete>
  "Delete":0,                                  <ReadCount>9</ReadCount>
  "ReadCount":1,                               <ReadSize>735726</ReadSize>
  "ReadSize":104744,                           <WriteCount>1</WriteCount>
  "WriteCount":0,                              <WriteSize>157145</WriteSize>
  "WriteSize":0,                               <Distribution
  "Distribution":                                U1K="45725"
  {                                              U2K="192523"
    "U1K="45725,                                 U4K="137055"
    "U2K="192523,                                U8K="39740"
    "U4K="137055,                                U16K="13408"
    "U8K="39740,                                 U32K="12303"
    "U16K="13408,                                U64K="11462"
    "U32K="12303,                                U128K="2560"
    "U64K="11462,                                U256K="22"
    "U128K="2560,                                U512K="0"
    "U256K="22,                                  U1M="45725"
    "U512K="0,                                   U2M="192523"
    "U1M="45725,                                 U4M="137055"
    "U2M="192523,                                U8M="39740"
    "U4M="137055,                                U16M="13408"
    "U8M="39740,                                 U32M="12303"
    "U16M="13408,                                U64M="11462"
    "U32M="12303,                                U128M="2560"
    "U64M="11462,                                U256M="22"
    "U128M="2560,                                U512M="0"
    "U256M="22,                                  U1G="0"
    "U512M="0,                                   U2G="0"
    "U1G="0,                                     U4G="0"
    "U2G="0,                                     U8G="0"
    "U4G="0,                                     U16G="0"
    "U8G="0,                                     O16G="0" />
    "U16G":0,                                  </Disk>
    "O16G":0

  }
}
TotalSize (unit: bytes)The total size of local files.CreateThe number of created local files.OpenThe number of opened local files.DeleteThe number of deleted local files.ReadCountThe number of times a local file is read.ReadSize (unit: bytes)The total size of read local files.WriteCountThe number of times a local file is written.WriteSize (unit: bytes)The total size of written local files.DistributionDistribution of local files based on size.U1KThe number of files under 1 KB.U2KThe number of files under 2 KB.U4KThe number of files under 4 KB.U8KThe number of files under 8 KB.U16KThe number of files under 16 KB.U32KThe number of files under 32 KB.U64KThe number of files under 64 KB.U128KThe number of files under 128 KB.U256KThe number of files under 256 KB.U512KThe number of files under 512 KB.U1MThe number of files under 1 MB.U2MThe number of files under 2 MB.U4MThe number of files under 4 MB.U8MThe number of files under 8 MB.U16MThe number of files under 16 MB.U32MThe number of files under 32 MB.U64MThe number of files under 64 MB.U128MThe number of files under 128 MB.U256MThe number of files under 256 MB.U512MThe number of files under 512 MB.U1GThe number of files under 1 GB.U2GThe number of files under 2 GB.U4GThe number of files under 4 GB.U8GThe number of files under 8 GB.U16GThe number of files under 16 GB.O16GThe number of files over 16 GB.
Session Statistics
Provides the session statistics.
"Session":                                   <Session
{                                              Client="30"
  "Client":30,                                 ActiveClient="20"
  "ActiveClient":20,                           Origin="12"
  "Origin":12,                                 ActiveOrigin="7" />
  "ActiveOrigin":7
},
ClientThe number of total HTTP client sessions.ActiveClientThe number of transmitting sessions among HTTP clients.OriginThe number of total origin server sessions.ActiveOriginThe number of transmitting sessions among origin server sessions.
DIMS Statistics
Provides DIMS performance statistics.
"Dims":                                   <Dims
{                                           Requests="30"
  "Requests": 30,                           Converted="29"
  "Converted": 29,                          Failed="1"
  "Failed": 1,                              AvgSrcSize="1457969"
  "AvgSrcSize": 1457969,                    AvgDestSize="598831"
  "AvgDestSize": 598831,                    AvgTime="34" />
  "AvgTime": 34
},
RequestsThe number of conversion requests.ConvertedThe number of conversion successes.FailedThe number of conversion failures.AvgSrcSize (unit: bytes)The average size of source images.AvgDestSize (unit: bytes)The average size of converted images.AvgTime (unit: ms)The elapsed time for conversion.
Compression Statistics
Provides compression performance statistics.
"Compression":                             <Compression
{                                           Requests="30"
  "Requests": 30,                           Converted="29"
  "Converted": 29,                          Failed="1"
  "Failed": 1,                              AvgSrcSize="1457969"
  "AvgSrcSize": 1457969,                    AvgDestSize="598831"
  "AvgDestSize": 598831,                    AvgTime="34" />
  "AvgTime": 34
},
RequestsThe number of compression requests.ConvertedThe number of compression statistics.FailedThe number of compression failures.AvgSrcSize (unit: bytes)The average size of source files.AvgDestSize (unit: bytes)The average size of compressed files.AvgTime (unit: ms)The elapsed time for compression.
Origin Server Statistics
Provides statistics for the traffic between STON and the origin server.
"OriginTraffic":                             <OriginTraffic>
{                                              <HttpReqCount Sum="600">2</HttpReqCount>
  "HttpReqCountSum":0,                         <HttpReqHeaderSize>3238</HttpReqHeaderSize>
  "HttpReqCount":0,                            <HttpReqBodySize>0</HttpReqBodySize>
  "HttpReqHeaderSize":269,                     <HttpResHeaderSize>2020</HttpResHeaderSize>
  "HttpReqBodySize":0,                         <HttpResBodySize>104894</HttpResBodySize>
  "HttpResHeaderSize":169,                     <Response>
  "HttpResBodySize":0,                           <ResTotal>
  "Response":                                      <Count Sum="8100">13</Count>
  {                                                <Completed Sum="8100">12</Completed>
    "ResTotal":                                    <TimeRes>1553</TimeRes>
    {                                              <TimeComplete>6630</TimeComplete>
      "CountSum":0,                              </ResTotal>
      "Count":1,                                 <Res2xx>
      "CompletedSum":0,                            <Count Sum="8100">1</Count>
      "Completed":1,                               <Completed Sum="8100">1</Completed>
      "TimeRes":3300,                              <TimeRes>3300</TimeRes>
      "TimeComplete":3300                          <TimeComplete>69300</TimeComplete>
    },                                           </Res2xx>
    "Res2xx":                                    <Res3xx>
    {                                              <Count Sum="8100">12</Count>
      "CountSum":0,                                <Completed Sum="8100">11</Completed>
      "Count":0,                                   <TimeRes>1408</TimeRes>
      "CompletedSum":0,                            <TimeComplete>1408</TimeComplete>
      "Completed":0,                             </Res3xx>
      "TimeRes":0,                               <Res4xx>
      "TimeComplete":0                             <Count Sum="8100">0</Count>
    },                                             <Completed Sum="8100">0</Completed>
    "Res3xx":                                      <TimeRes>0</TimeRes>
    {                                              <TimeComplete>0</TimeComplete>
      "CountSum":0,                              </Res4xx>
      "Count":1,                                 <Res5xx>
      "CompletedSum":0,                            <Count Sum="8100">0</Count>
      "Completed":1,                               <Completed Sum="8100">0</Completed>
      "TimeRes":3300,                              <TimeRes>0</TimeRes>
      "TimeComplete":3300                          <TimeComplete>0</TimeComplete>
    },                                           </Res5xx>
    "Res4xx":                                    <ConnectTimeout Sum="8100">0</ConnectTimeout>
    {                                            <ReceiveTimeout Sum="8100">0</ReceiveTimeout>
      "CountSum":0,                              <Close Sum="8100">0</Close>
      "Count":0,                               </Response>
      "CompletedSum":0,                        <Connect>
      "Completed":0,                             <Count>0</Count>
      "TimeRes":0,                               <AvgDNSQueryTime>0</AvgDNSQueryTime>
      "TimeComplete":0                           <AvgConnTime>0</AvgConnTime>
    },                                         </Connect>
    "Res5xx":                                </OriginTraffic>
    {
      "CountSum":0,
      "Count":0,
      "CompletedSum":0,
      "Completed":0,
      "TimeRes":0,
      "TimeComplete":0
    },
    "ConnectTimeoutSum":0,
    "ConnectTimeout":0,
    "ReceiveTimeoutSum":0,
    "ReceiveTimeout":0,
    "CloseSum":0,
    "Close":0
  },
  "Connect":
  {
    "Count":0,
    "AvgDNSQueryTime":0,
    "AvgConnTime":0
  }
},
HttpReqCountThe number of HTTP requests sent to the origin server.HttpReqHeaderSize (unit: bytes)The size of the HTTP header sent to the origin server.HttpReqBodySize (unit: bytes)The size of the HTTP body sent to the origin server.HttpResHeaderSize (unit: bytes)The size of the HTTP header received by the origin server.HttpResBodySize (unit: bytes)The size of the HTTP body received by the origin server.ResponseThe responses from the origin server.ResXXXThe statistics for the type of response (2xx, 3xx, 4xx, 5xx, total).CountThe number of responses.CompletedThe number of properly transferred HTTP transactions.TimeResThe HTTP response time.TimeCompleteThe completion time for HTTP transactions.
ConnectTimeoutThe number of connection failures.ReceiveTimeoutThe number of transmission delays.CloseThe number of times the origin server closes the socket during transmissions.
ConnectOrigin server connection statistics.CountThe number of connections.AvgDNSQueryTime (unit: 0.01 ms)The average DNS query time.AvgConnTime (unit: 0.01 ms)The average connection time (from TCP SYN transmission to TCP SYN ACK reception).
Note
These statistics are only provided in five-minute increments.
HttpReqCountSumThe total number of HTTP requests.CountSumThe total number of HTTP responses.CompletedSumThe total number of completed HTTP transactions.ConnectTimeoutSumThe total number of origin server connection failures.ReceiveTimeoutSumThe total number of origin server transmission delays.CloseSumThe total number of connections closed by the origin server.
Port Bypass Statistics
Provides statistics on traffic from <PortBypass>
"PortBypass":                                            <PortBypass SrcPort="1935" DestPost="1935">
[                                                          <Session>0</Session>
  {                                                        <Hit Established="0"
    "SrcPort":1935, "DestPort":1935, "Session":0,               ClientClosed="0"
    "Hit":                                                      OriginClosed="0"
    {                                                           OriginCT="0" />
      "Established":0, "ClientClosed":0,                   <ClientTraffic In="0" Out="0"/>
      "OriginClosed":0, "OriginCT":0                       <OriginTraffic In="0" Out="0"/>
    },                                                   </PortBypass>
    "ClientTraffic": { "In":0, "Out":0 },                <PortBypass SrcPort="1936" DestPost="1936">
    "OriginTraffic": { "In":0, "Out":0 }                   <Session>17</Session>
  },                                                       ...
  {                                                      </PortBypass>
    "SrcPort":1936, "DestPort":1936, "Session":17,
    ...
  }
],
SrcPort/DestPortThe bypassed STON/origin server port.SessionThe number of currently connected sessions.HitBypass connection statistics.EstablishedThe number of established connections.ClientClosedThe number of connections closed by clients.OriginClosedThe number of connections closed by the origin server.OriginCTThe number of origin server connection failures.
ClientTraffic (unit: bytes)Client traffic (In=Inbound, Out=Outbound).OriginTraffic (unit: bytes)Origin server traffic (In=Inbound, Out=Outbound).
Client Statistics
Client traffic can be portrayed in Traffic in multiple ways depending on the statistics configuration for each directory. If directory statistics have not been configured, all traffic will be counted as the root (/) directory. If they have been configured, only the root directory and directories with traffic will be displayed.
"ClientTraffic":                             <ClientTraffics Depth="0" Accum="OFF" HttpsTraffic="OFF">
{                                              <TrafficCount>1</TrafficCount>
  "Depth":0,                                   <Traffic RequestHitRatio="0">
  "Accum":"OFF",                                 <Path>/</Path>
  "HttpsTraffic":"OFF",                          <HttpReqCount Sum="0">0</HttpReqCount>
  "TrafficCount":1,                              <HttpReqHeaderSize>4113</HttpReqHeaderSize>
  "Traffic":                                     <HttpReqBodySize>0</HttpReqBodySize>
  [                                              <HttpResHeaderSize>3066</HttpResHeaderSize>
    {                                            <HttpResBodySize>892871</HttpResBodySize>
      "RequestHitRatio" : 9984,                  <Response>
      "Path":"/",                                  <ResTotal>
      "HttpReqCountSum":0,                           <Count Sum="0">18</Count>
      "HttpReqCount":100,                            <Completed Sum="0">18</Completed>
      "HttpReqHeaderSize":13968,                     <TimeRes>666</TimeRes>
      "HttpReqBodySize":0,                           <TimeComplete>4377</TimeComplete>
      "HttpResHeaderSize":5654,                    </ResTotal>
      "HttpResBodySize":104744,                    <Res2xx>
      "Response":                                    <Count Sum="0">10</Count>
      {                                              <Completed Sum="0">10</Completed>
        "ResTotal":                                  <TimeRes>1200</TimeRes>
        {                                            <TimeComplete>7870</TimeComplete>
          "CountSum":0,                            </Res2xx>
          "Count":52,                              <Res3xx>
          "CompletedSum":0,                          <Count Sum="0">8</Count>
          "Completed":52,                            <Completed Sum="0">8</Completed>
          "TimeRes":94,                              <TimeRes>0</TimeRes>
          "TimeComplete":107                         <TimeComplete>12</TimeComplete>
        },                                         </Res3xx>
        "Res2xx":                                  <Res4xx>
        {                                            <Count Sum="0">0</Count>
          "CountSum":0,                              <Completed Sum="0">0</Completed>
          "Count":1,                                 <TimeRes>0</TimeRes>
          "CompletedSum":0,                          <TimeComplete>0</TimeComplete>
          "Completed":1,                           </Res4xx>
          "TimeRes":4700,                          <Res5xx>
          "TimeComplete":4800                        <Count Sum="0">0</Count>
        },                                           <Completed Sum="0">0</Completed>
        "Res3xx":                                    <TimeRes>0</TimeRes>
        {                                            <TimeComplete>0</TimeComplete>
          "CountSum":0,                            </Res5xx>
          "Count":51,                            </Response>
          "CompletedSum":0,                      <SSL RecvSize="0" SendSize="0"/>
          "Completed":51,                        <RequestHit
          "TimeRes":3,                             TCP_NONE="0"
          "TimeComplete":15                        TCP_HIT="0"
        },                                         TCP_IMS_HIT="0"
        "Res4xx":                                  TCP_REFRESH_HIT="0"
        {                                          TCP_REF_FAIL_HIT="0"
          "CountSum":0,                            TCP_NEGATIVE_HIT="0"
          "Count":0,                               TCP_REDIRECT_HIT="0"
          "CompletedSum":0,                        TCP_MISS="0"
          "Completed":0,                           TCP_REFRESH_MISS="0"
          "TimeRes":0,                             TCP_CLIENT_REFRESH_MISS="0"
          "TimeComplete":0                         TCP_DENIED="0"
        },                                         TCP_ERROR="0"/>
        "Res5xx":                                <RequestHitSum
        {                                          TCP_NONE="0"
          "CountSum":0,                            TCP_HIT="0"
          "Count":0,                               TCP_IMS_HIT="0"
          "CompletedSum":0,                        TCP_REFRESH_HIT="0"
          "Completed":0,                           TCP_REF_FAIL_HIT="0"
          "TimeRes":0,                             TCP_NEGATIVE_HIT="0"
          "TimeComplete":0                         TCP_REDIRECT_HIT="0"
        }                                          TCP_MISS="0"
      },                                           TCP_REFRESH_MISS="0"
      "SSL":                                       TCP_CLIENT_REFRESH_MISS="0"
      {                                            TCP_DENIED="0"
        "RecvSize":0,                              TCP_ERROR="0"/>
        "SendSize":0                           </Traffic>
      },                                       <FileSystem>
      "RequestHit":                              <GetAttr
      {                                            TimeRes="0"
        "TCP_NONE":0,                              FileCount="0"
        "TCP_HIT":0,                               DirCount="0"
        "TCP_IMS_HIT":0,                           FailCount="0">0</GetAttr>
        "TCP_REFRESH_HIT":0,                     <Open TimeRes="0">0</Open>
        "TCP_REF_FAIL_HIT":0,                    <Read
        "TCP_NEGATIVE_HIT":0,                      TimeRes="0"
        "TCP_REDIRECT_HIT":0,                      BufferSize="0"
        "TCP_MISS":0,                              BufferFilled="0">0</Read>
        "TCP_REFRESH_MISS":0,                    <RequestHit
        "TCP_CLIENT_REFRESH_MISS":0,               TCP_NONE="0"
        "TCP_DENIED":0,                            TCP_HIT="0"
        "TCP_ERROR":0                              TCP_IMS_HIT="0"
      },                                           TCP_REFRESH_HIT="0"
      "RequestHitSum":                             TCP_REF_FAIL_HIT="0"
      {                                            TCP_NEGATIVE_HIT="0"
        "TCP_NONE":0,                              TCP_REDIRECT_HIT="0"
        "TCP_HIT":0,                               TCP_MISS="0"
        "TCP_IMS_HIT":0,                           TCP_REFRESH_MISS="0"
        "TCP_REFRESH_HIT":0,                       TCP_CLIENT_REFRESH_MISS="0"
        "TCP_REF_FAIL_HIT":0,                      TCP_DENIED="0"
        "TCP_NEGATIVE_HIT":0,                      TCP_ERROR="0"/>
        "TCP_REDIRECT_HIT":0,                    <RequestHitSum
        "TCP_MISS":0,                              TCP_NONE="0"
        "TCP_REFRESH_MISS":0,                      TCP_HIT="0"
        "TCP_CLIENT_REFRESH_MISS":0,               TCP_IMS_HIT="0"
        "TCP_DENIED":0,                            TCP_REFRESH_HIT="0"
        "TCP_ERROR":0                              TCP_REF_FAIL_HIT="0"
      },                                           TCP_NEGATIVE_HIT="0"
      "FileSystem":                                TCP_REDIRECT_HIT="0"
      {                                            TCP_MISS="0"
        "GetAttr" :                                TCP_REFRESH_MISS="0"
        {                                          TCP_CLIENT_REFRESH_MISS="0"
          "TimeRes" : 0,                           TCP_DENIED="0"
          "FileCount" : 0,                         TCP_ERROR="0"/>
          "DirCount" : 0,                      </FileSystem>
          "FailCount" : 0,                   </ClientTraffics>
          "TotalCount" : 0
        },
        "Open" :
        {
          "TimeRes" : 0,
          "Count" : 0
        },
        "Read" :
        {
          "TimeRes" : 0,
          "BufferSize" : 0,
          "BufferFilled" : 0,
          "Count" : 0
        },
        "RequestHit":
        {
          "TCP_NONE":0,
          "TCP_HIT":0,
          "TCP_IMS_HIT":0,
          "TCP_REFRESH_HIT":0,
          "TCP_REF_FAIL_HIT":0,
          "TCP_NEGATIVE_HIT":0,
          "TCP_REDIRECT_HIT":0,
          "TCP_MISS":0,
          "TCP_REFRESH_MISS":0,
          "TCP_CLIENT_REFRESH_MISS":0,
          "TCP_DENIED":0,
          "TCP_ERROR":0
        },
        "RequestHitSum":
        {
          "TCP_NONE":0,
          "TCP_HIT":0,
          "TCP_IMS_HIT":0,
          "TCP_REFRESH_HIT":0,
          "TCP_REF_FAIL_HIT":0,
          "TCP_NEGATIVE_HIT":0,
          "TCP_REDIRECT_HIT":0,
          "TCP_MISS":0,
          "TCP_REFRESH_MISS":0,
          "TCP_CLIENT_REFRESH_MISS":0,
          "TCP_DENIED":0,
          "TCP_ERROR":0
        }
      }
    }
  ]
}
DepthThe directory depth for statistics to be collected.AccumWhether or not directory statistics are accumulated in parent directories.HttpsTrafficWhether or not HTTPS traffic is included in HTTP traffic.TrafficCountThe aggregated traffic count.TrafficStatistics for each directory. The root (/) always has traffic.PathThe service directory.HttpReqCount (unit: bytes)The number of HTTP requests sent by clients.HttpReqHeaderSize (unit: bytes)The size of HTTP request headers sent by clients.HttpReqBodySize (unit: bytes)The size of HTTP request bodies sent by clients.HttpResHeaderSize (unit: bytes)The size of HTTP response headers sent by STON.HttpResBodySize (unit: bytes)The size of HTTP response bodies sent by STON.ResponseResponses sent by STON.CountThe number of responses.CompletedThe number of properly completed HTTP transactions.TimeResThe HTTP response time.TimeCompleteThe HTTP transaction completion time.
SSL (unit: bytes)HTTPS traffic (RecvSize=received size, SendSize=transmitted size).RequestHitThe cache HIT result.FileSystemFileSystem access.GetAttrThe getattr function call count and response time (FileCount: File response, DirCount: Dir response, FailCount: failure response).OpenThe open function call count and response time.ReadThe read function call count, response time, requested size (BufferSize), and response size (BufferFilled).RequestHit(File I/O access) The cache HIT result.
Note
These statistics are only provided in five-minute increments.
HttpReqCountSumThe total number of HTTP requests.CountSumThe total number of HTTP responses.CompletedSumThe total number of completed HTTP transactions.RequestHitSumThe cache HIT result.
View
View is a method that ties multiple virtual hosts into one to extract statistics. The concept came from viewing multiple tables as one table in a database. As shown below, the setup is very simple.
# vhosts.xml

<Vhosts>
  <Vhost> ... </Vhost>
  <Vhost> ... </Vhost>
  ... (omitted) ...
  <View Name="SK">
    <Vhost>...</Vhost>
    <Vhost>...</Vhost>
  </View>
  <View Name="KT">
    <Vhost>...</Vhost>
    <Vhost>...</Vhost>
    <Vhost>...</Vhost>
  </View>
  <View Name="LG">
    <Vhost>...</Vhost>
    <Vhost>...</Vhost>
  </View>
</Vhosts>
View can even be set up with virtual hosts that don’t exist. The following are the formats that View provides statistics in.
-  Realtime XML/JSON
-  SNMP - cache(1.3.6.1.4.1.40001.1.4).10 ~ 12
Let’s explore an example where View can be used. Say there are three administrators running communities for their favorite sports: baseball.com, basketball.com, and football.com.
# vhosts.xml

<Vhosts>
  <Vhost Name="baseball.com"> ... </Vhost>
  <Vhost Name="basketball.com"> ... </Vhost>
  <Vhost Name="football.com"> ... </Vhost>
</Vhosts>
They decide to come together to open a combined sports community service, choosing sports.com as the domain name to encompass all the different sports. The objectives that must be met by the development/management team are as follows.
- The combined service must be provided through sports.com.
- The existing domains and services must be maintained for the existing users.
- The development teams must be combined. The management teams must be combined.
- Only the home page should be developed, connecting to existing services via links.
To realistically meet these demands, the development team decides to specify the existing domains as part of the first directory, as shown below.
# Existing services
http://baseball.com/standing/list.html
http://basketball.com/stats/2014/view.html
http://football.com/player/messi.php

# Combined service
http://sports.com/baseball/standing/list.html
http://sports.com/basketball/stats/2014/view.html
http://sports.com/football/player/messi.php
This can easily be configured using the URL preprocessor.
# vhosts.xml

<Vhosts>
  <Vhost Name="baseball.com"> ... </Vhost>
  <Vhost Name="basketball.com"> ... </Vhost>
  <Vhost Name="football.com"> ... </Vhost>
  <URLRewrite>
    <Pattern>sports.com/(.*)/(.*)</Pattern>
    <Replace>#1.com/#2</Replace>
  </URLRewrite>
</Vhosts>
The newly merged management team must now monitor not only their individual services but also the combined service (e.g. traffic, session, response codes). Most administrators familiar with SNMP will set up View to obtain these combined statistics.
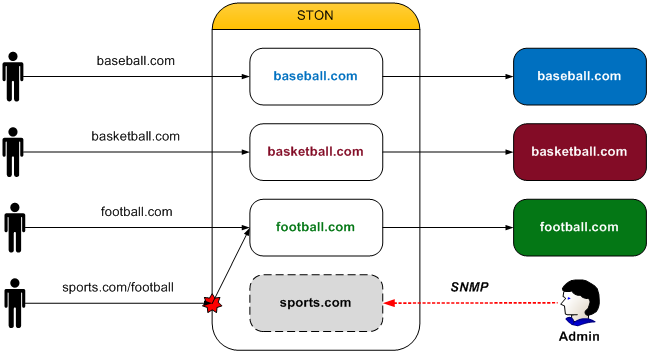
# vhosts.xml

<Vhosts>
   <Vhost Name="baseball.com"> ... </Vhost>
   <Vhost Name="basketball.com"> ... </Vhost>
   <Vhost Name="football.com"> ... </Vhost>
   <URLRewrite>
      <Pattern>sports.com/(.*)/(.*)</Pattern>
      <Replace>#1.com/#2</Replace>
   </URLRewrite>
   <View Name="sports.com">
      <Vhost>baseball.com</Vhost>
      <Vhost>basketball.com</Vhost>
      <Vhost>football.com</Vhost>
   </View>
</Vhosts>
As seen in the above example, the combination of URL Rewrite and View can effectively tie existing sites together into a single service.
View Statistics
Provides statistics identical to the virtual host statistics, with the only difference being the names of the tags, as shown below.
"View":                                  <View ...>
[                                           ...
  { ... },                               </View>
  { ... },                               <View> ... </View>
]                                        <View> ... </View>
Checking the Virtual Host List
The virtual host list can be checked.
http://127.0.0.1:10040/monitoring/vhostslist
The results are returned in JSON format.
{
    "version": "2.0.0",
    "method": "vhostslist",
    "status": "OK",
    "result": [ "www.example.com","www.winesoft.com", "site1.com" ]
}
Caching Information
The status of files being cached can be monitored. Generally, files can be distinguished by URLs, but if the same URL can have different options (e.g. Accept-Encoding), then there may also be multiple files.
http://127.0.0.1:10040/monitoring/fileinfo?url=example.com/sample.dat
The results are returned in JSON format. The following is the result of looking up the information of a /sample.dat file.
{
    "version": "2.0.0",
    "method": "fileinfo",
    "status": "OK",
    "result":
    [
        {
            "URI": "/sample.dat",
            "Accept-Encoding": "N",
            "RefCount": 0,
            "Disk-Index": 0,
            "Size": 2100267,
            "FID": 24267,
            "LocalPath": "/cache1/example.com/000i/q3.bin",
            "File-Opened ": "N",
            "File-Updating": "-",
            "Downloader-Count": "0",
            "LastAccess": "[ 2012.09.03 14:29:50, -2 ]",
            "UpdateTime": "[ 2012.09.03 13:53:43, -2169 ]",
            "TTL-Left": "[ 2012.10.03 13:53:43, 2589831 ]",
            "ResponseCode": 200,
            "ContentType": "text/plain",
            "LastModifiedTime": "[ 2010.11.22 20:31:47, -56224685 ]",
            "ExpireTime": "[ 0, 0 ]",
            "CacheControl": "not-specified",
            "ETag": "502dd614:200c2b",
            "CustomTTL": 0,
            "NoMoreExist": "N",
            "LocalFileExist": "Y",
            "SmallFile": "N",
            "State": "Cached",
            "Deleted": "N",
            "AddedSize": "Y",
            "TransferEncoding": "N",
            "Compression": "-",
            "Purge": "N",
            "Ignore-IMS ": "N",
            "Redirect-Location ": "-",
            "Content-Disposition ": "-",
            "NoCache": "N"
        }
    ]
}
URIThe file URI.Accept-Encoding(“Y” or “N”) “Y” if Accept-Encoding is supported.RefCountThe file reference count.Size(bytes) The file size.Disk-Index(starts from 0) The saved disk index.FIDThe file ID.LocalPathThe local path.File-Opened(“Y” or “N”) “Y” if a local file is opened.File-UpdatingSpecifies the pointer to the updated object if a file is being updated.Downloader-CountThe number of sessions downloading this file from the origin server.LastAccess(last accessed time, last accessed time - current time) [ 2012.09.03 14:29:50, -2 ] would mean that the file was last accessed 2 seconds before the current time, on 2012.09.03 14:29:50.UpdateTime(modified time, modified time - current time) The last time the file was modified. A 304 Not Modified response also updates the time.TTL-Left(expiration time, expiration time - current time) The time left until the content expires. The value is positive if there is still TTL left, and negative if already expired.ResponseCodeThe origin server response code.ContentTypeThe MIME Type.LastModifiedTime(Last Modified Time, Last Modified Time - current time) The Last Modified Time sent by the origin server. If the origin server did not send this value, it will return zero.ExpireTime(Expire Time, Expire Time - current time) The Expire Time sent by the origin server. If the origin server did not send this value, it will return zero.CacheControl(“no-cache” or “not-specified” or an integer) The Cache-Control value sent by the origin server.ETagThe ETag created by STON.CustomTTLCustom TTL. If not configured, zero is returned.NoMoreExist(“Y” or “N”) “Y” if file is pending deletion.LocalFileExist(“Y” or “N”) “Y” if the file exists locally (files not 200 OK are always “Y”).SmallFile(“Y” or “N”) “Y” is the file is considered a small file (for development purposes).State(“Not Init” or “Cached” or “Error”) The file status.Deleted(“Y” or “N”) “Y” if the file is deleted (for development purposes).AddedSize(“Y” or “N”) “Y” if the size is reflected in the statistics (for development purposes).TransferEncoding(“Y” or “N”) “Y” if Transfer-Encoding is supported.CompressionThe compression method.Purge(“Y” or “N”) “Y” if purged.Ignore-IMS(“Y” or “N”) “Y” if not configured to send an If-Modified-Since header during updates.Redirect-LocationThe Location header value.Content-DispositionThe Content-Disposition header value.NoCache(“Y” or “N”) “Y” if the origin server responds with no-cache.
Log Trace
Receives the log in real time while it’s being recorded. Access, Origin, and Monitoring logs must specify a virtual host.
http://127.0.0.1:10040/monitoring/logtrace/info
http://127.0.0.1:10040/monitoring/logtrace/deny
http://127.0.0.1:10040/monitoring/logtrace/sys
http://127.0.0.1:10040/monitoring/logtrace/originerror
http://127.0.0.1:10040/monitoring/logtrace/access?vhost=www.site1.com
http://127.0.0.1:10040/monitoring/logtrace/origin?vhost=www.site1.com
http://127.0.0.1:10040/monitoring/logtrace/monitoring?vhost=www.site1.com