Chapter 19. Optimization and More
This chapter will discuss optimization and other miscellaneous advanced topics. Optimization is a method used to obtain high performance, which is biggest merit that we are pursuing. In an enterprise environment, if hardware is high-performance, it can also mean that it uses as much resources as possible.
Among those resources is memory, the resource that is most important to all plans and policies. Memory indexing (finding requested URLs quickly) is especially important to understand, because indexing is what determines the quality of the service. The following table, displaying the default values based on the physical memory size, will be referred back to by the rest of the section.
| Physical RAM | System Free | Contents | Caching Count | Sockets |
|---|---|---|---|---|
| 1GB | 409.60MB | 188.37MB | 219,469 | 5,000 |
| 2GB | 819.20MB | 446.74MB | 520,494 | 10,000 |
| 4GB | 1.60GB | 963.49MB | 1,122,544 | 20,000 |
| 8GB | 3.20GB | 2.05GB | 2,440,422 | 20,000 |
| 16GB | 6.40GB | 4.45GB | 5,303,733 | 20,000 |
| 32GB | 12.80GB | 9.25GB | 11,030,356 | 20,000 |
| 64GB | 25.60GB | 18.85GB | 22,483,603 | 20,000 |
| 128GB | 51.20GB | 38.05GB | 45,390,095 | 20,000 |
Indexing
In order to explain indexing, you must first understand the idea of “hot” and “cold” content.
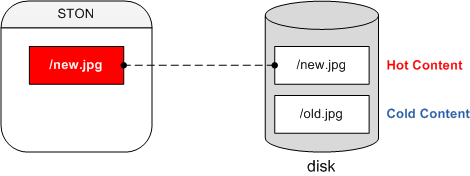
Content cached from the origin server is saved on the local disk. If that content must be read from the disk whenever it is accessed, performance will definitely decrease. As such, we can obtain higher performance by loading frequently requested content into memory. We will refer to content loaded into memory as hot content, and content located only on the disk as cold content.
Indexing refers to the process of locating hot and cold content and directly affects performance. The default is memory indexing.
# server.xml - <Server><Cache>

<Indexing>Memory</Indexing>
Memory indexing does not keep a record of cold content. Information about all files is loaded into memory, so if a file cannot be found, it will be downloaded from the origin server. Because the search time is very short, we can obtain an increase in performance and service quality. However, this is limited by the memory storage size as well as the caching count, which is listed in the above table.
In disk indexing, if the requested file is not in hot content, it will look in cold content before going to the origin server.
# server.xml - <Server><Cache>

<Indexing>Disk</Indexing>
This method is not limited by memory and therefore is not limited by the caching count. It can guarantee speed if the content is hot, but it will be relatively slower if the content is slow, due to it having to use the disk. In other words, hot content is based on memory speed, and cold content is based on disk speed.
If using disk indexing, it is highly recommended that you also use a solid-state drive (SSD). Indexing is only performed on the disk that STON is installed on. Because STON is generally installed on the same disk as the OS, you can expect high performance just by using an SSD for the OS disk.
Note
SSD endurance is determined not by access frequency but by the amount that can be written. SSDs from Intel or Samsung can guarantee a write endurance of 600 TB. In other words, if 20 GB is written in a day, then the SSD can last for about 10 years. 99% of STON’s writing operations is logging. Therefore, it is recommended to log on disks other than SSDs (such as SAS or SATA) to ensure the disk’s endurance.
Warning
Indexing cannot be changed dynamically, and even if it is changed, it will not guarantee stability. Therefore, you must perform Caching Reset in order to safely proceed with the service.
Memory Structure
The cache server can have the same behaviors as a general web server, but their objectives are quite different. Even better service optimization is possible if you can thoroughly understand the structure and behaviors of STON. The purpose of optimization is as follows.
High throughput. Handling tens of thousands of sessions simultaneously without a drop in performance.
Fast responsiveness. Providing a service to clients without delay.
Reduction in origin server load. Preventing an overload on the origin server in advance.
The following figures represent the memory structure of STON with 8 GB and 16 GB memory.
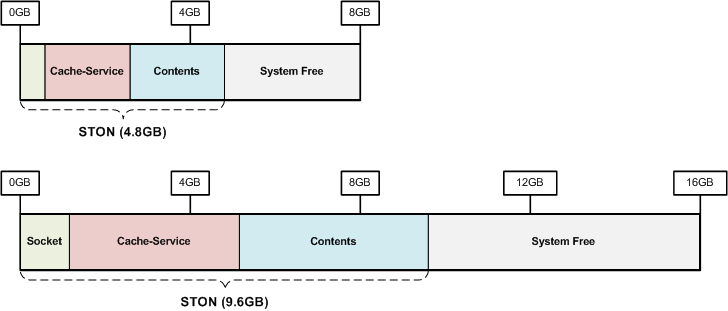
Memory is divided into memory used by STON and free memory not used by STON. Like files and sockets, the memory used by STON can change based on the scale of the service.
Note
The basis of system load is disk I/O. You will have to consider how much content should be cached in order to reduce disk I/O.
Memory Management
Memory Structure will automatically be calculated based on the size of physical memory.
# server.xml - <Server><Cache>

<SystemMemoryRatio>100</SystemMemoryRatio>
<SystemMemoryRatio> (default: 100)Configures the ratio of memory used by STON using physical memory as the basis.
For example, if memory is 8 GB and <SystemMemoryRatio> is set to 50, it will act as if there is 4 GB of physical memory. This can be useful if STON is run alongside other processes that take up space in memory.
It can be even more effective to adjust the ratio of content stored in memory based on the specifics of the service.
# server.xml - <Server><Cache>

<ContentMemoryRatio>50</ContentMemoryRatio>
<ContentMemoryRatio> (default: 50)Configures the ratio of memory used for content to the total memory used by STON.
For example, if the file count is small but the content size is huge (like a game portal), you can increase this value to reduce file I/O. Conversely, if you have a lot of very small files, decreasing this value will be more useful.
System Free Memory
If the operating system (OS) is slow, no program will be able to obtain good performance. STON will set aside a portion of memory for the OS. This is to maximize the performance of the OS and is called system free memory.
| Physical RAM | System Free |
|---|---|
| 1GB | 409.6MB |
| 2GB | 819.2MB |
| 4GB | 1.6GB |
| 8GB | 3.2GB |
| 16GB | 6.4GB |
| 32GB | 12.8GB |
| 64GB | 25.6GB |
| 128GB | 51.2GB |
An experienced user will be able to adjust the free memory to what’s best for their service. Reducing free memory will mean loading more content into memory.
# server.xml - <Server><Cache>

<SystemFreeMemoryRatio>40</SystemFreeMemoryRatio>
<SystemFreeMemoryRatio> (default: 40, max: 40)Configures the ratio of memory set aside for free memory using physical memory as a basis.
Caching Service Memory
This is the memory that caches content that is delivered to clients. Content loaded into memory once will continue to exist in memory, as long as there is enough space. The problem is that there will often not be enough space.
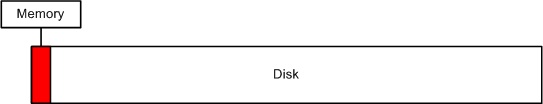
As seen in the above figure, the disk can be full of deliverable content, but the actual capacity of memory is limited. Even if you have 32 GB of physical memory, when you consider the size of game clients or HD video clips, it isn’t that much. No matter how efficiently you manage memory, it will only amount to the speed of the physical disk I/O.
The most effective method is to use as much available content memory space and reduce disk I/O. The following is a table of STON’s default settings for maximum content memory size based on physical memory.
| Physical RAM | Contents | Caching Count |
|---|---|---|
| 1GB | 188.37MB | 219,469 |
| 2GB | 446.74MB | 520,494 |
| 4GB | 963.49MB | 1,122,544 |
| 8GB | 2.05GB | 2,440,422 |
| 16GB | 4.45GB | 5,303,733 |
| 32GB | 9.25GB | 11,030,356 |
| 64GB | 18.85GB | 22,483,603 |
| 128GB | 38.05GB | 45,390,095 |
Socket Memory
Sockets also use memory. If you have at least 4 GB of physical memory, then STON will by default generate at least twenty thousand sockets. With one socket equaling 10 KB, ten thousand sockets will use about 97.6 MB. About 195 MB of memory will be alloted to sockets by default.
| Physical RAM | Socket Count | Socket Memory |
|---|---|---|
| 1GB | 5,000 | 97.6MB |
| 2GB | 10,000 | 195MB |
| 4GB or more | 20,000 | 390MB |
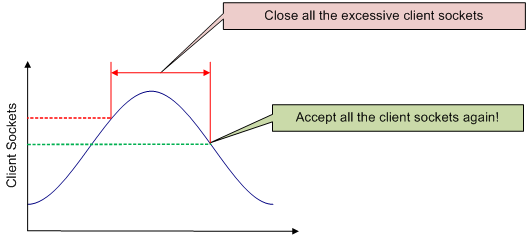
If all the sockets are used as in the following figure, more sockets will automatically created.
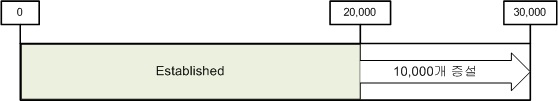
If, like the above figure, more sockets are installed to bring the number up to thirty thousand, that will mean about 240 MB will be alloted to sockets. There doesn’t seem to be any problem with using only the number of sockets that we need. However, setting up more sockets than we need to use is just a waste of memory. For example, to guarantee 10 Mbps for each client from 10 Gbps NIC, the following equation gives us a maximum simultaneous user count of one thousand people.
10,000 Mbps / 10 Mbps = 1,000 Sessions
In this case, out of the twenty thousand sockets created by STON, only nineteen thousand are used, wasting about 148 MB. This 148 MB could be used for content, increasing efficiency. By setting the smallest possible number of sockets, we can gain use memory much more efficiently.
Minimum number of sockets. Refers to the number of initially alloted sockets.
Sockets that are installed later. Installs more sockets if all current sockets are established.
Another important factor is the Keep-Alive time setting for the client (see Session Management).

Not all connected sockets will be in the middle of transferring data. In browsers like IE or Chrome, sockets are maintained in an accessed state to prepare for the next HTTP transfer that will occur. Among the connected sessions in online shopping, the percentage of sessions that aren’t transferring any data ranges from 50% to 80%.
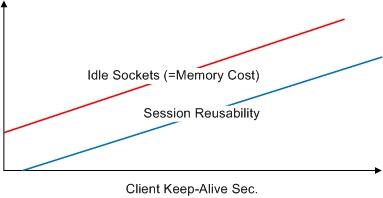
If the Keep-Alive time is long, the reusability of the socket is better, but there will be more idle sockets and more memory waste. As such, it is important to configure a client Keep-Alive time that works best for the service.
TCP Segmentation Offload
Important
If you’re using 10 Gbps NIC, it is recommended that you configure TCP Segmentation Offload (TCP) to OFF.
In TCP, packets go under segmentation; TSO configures it so that this process is done not by the CPU but by NIC. (The default setting is ON.) However, we have experienced many errors related to this in a 10 Gbps NIC service environment.
- TCP packet loss and delay
- TCP connection timeout
- Unnatural increase in the load average
In conclusion, we can assume that TSO is unable to provide the high performance we expected from it. (These problems did not occur when changing NIC to 1 Gbps.) When TSO was set to OFF, the service returned to normal. This is not a point of concern about the usage of CPU but a good benchmark for the scale of the service.
The TSO setting can be configured/checked with the following. (The K is case-sensitive.)
# ethtool -K ethX tso off        // TSO OFF setting
# ethtool -k ethX                // Setting check
...
tcp segmentation offload: on
...
Tip
Please refer to the following links for more information.
Client Request Limit
If you allow unlimited client requests, it can cause excessive load on the system. System overload is a very possible error. This can protect the system by preventing client requests over a certain number.
# server.xml - <Server><Cache>

<MaxSockets Reopen="75">80000</MaxSockets>
<MaxSockets> (default: 80000, max: 100000)The maximum number of client sockets that will be allowed. If the socket count falls below theReopen (default: 75%)ratio in<MaxSockets>, access will be reallowed.
Using the default settings, if the total client socket count exceeds 80,000, connections from new clients will immediately be closed. If the total client socket count falls to 60,000 (75% of 80,000), connections will be reallowed.
For example, there are thirty thousand client sessions and the origin servers have reached their limit, setting this value to thirty or forty thousand is recommended. Doing so, the available benefits are as follows.
- There is no need for a separate network setup (such as L4 session control).
- Prevents unnecessary client requests (that can’t be processed due to origin load).
- Raises service credibility. There will be no need for restarting or inspection during service bursts.
HTTP Client Session Count
Configures the initial/additional session count to process HTTP client connections.
# server.xml - <Server><Cache>

<HttpClientSession>
   <Init>20000</Init>
   <TopUp>6000</TopUp>
</HttpClientSession>
<Init>The number of sockets initially generated when STON is started.<TopUp>The number of additional sockets generated when the initial sockets are all in use.
When not specifically configured, the settings will be automatically configured based on the size of physical memory.
| Physical RAM | <Init>, <TopUp> |
|---|---|
| 1GB | 5 thousand, 1 thousand |
| 2GB | 10 thousand, 2 thousand |
| 4GB | 20 thousand, 4 thousand |
| 8GB or more | 20 thousand, 6 thousand |
If service is still possible with a smaller number of sockets in a limited environment, you can save on memory by lowering this socket count.
Request hit ratio
First, you must understand how client HTTP requests are processed. Caching processing results use the TCP_* format just like Squid, and each expression refers to how the cache server processed the request.
TCP_HITThe requested resource (not expired) is cached and will respond immediately.TCP_IMS_HITThe resource requested with the If-Modified-Since (IMS) header is not expired and still cached, and will respond with 304 NOT MODIFIED. This will also apply when TTLExtensionBy4xx or TTLExtensionBy5xx is set to ON.TCP_REFRESH_HITThe requested resource is expired and will respond after checking the origin server (origin not modified, 304 N OT MODIFIED). The expiration time of the resource is extended.TCP_REF_FAIL_HITThe origin server check during the TCP_REFRESH_HIT result fails (connection failure, transfer delay) and will respond with expired content.TCP_NEGATIVE_HITThe requested resource is abnormal (origin server connection/transfer failure, 4xx response, 5xx response) and will respond with its currently cached form.TCP_REDIRECT_HITResponds with a Redirect according to the service’s allow/deny/redirect conditions.TCP_MISSThe requested resource is not cached (requested for the first time) and will respond with the result of accessing the origin server.TCP_REF_MISSThe requested resource is expired and will respond after an origin server check (origin change, 200 OK). The new resource is cached.TCP_CLIENT_REFRESH_MISSThe request is bypassed to the origin server.TCP_ERRORThe requested resource is not cached (requested for the first time). Due to an origin server error (connection failure, transfer delay, origin exclusion) the resource was not cached. Responds with a 500 Internal Error to the client.TCP_DENIEDThe request is denied.
The request hit ratio can be calculated using the above results, and the formula is shown below.
TCP_HIT + TCP_IMS_HIT + TCP_REFRESH_HIT + TCP_REF_FAIL_HIT + TCP_NEGATIVE_HIT + TCP_REDIRECT_HIT
------------------------------------------------------------------------------------------------
                                         SUM(TCP_*)
Byte hit ratio
The byte hit ratio is the ratio of the client outbound traffic to the origin inbound traffic. A negative number can arise if the origin inbound traffic is higher than client outbound traffic.
Client Outbound - Origin Inbound
--------------------------------
        Client Outbound
Origin Server Failure Policy
One of the goals of the development team was to have the customer be able to examine the origin server at all times. If an error occurs on an origin server, the corresponding server will be excluded and go into restoration mode. Even if the server is reactivated, normal service operation must be confirmed before it can be put back into the service.
If all origin servers somehow end up in an error status, the service continues with only the content that was cached at the time. Expired content will have their TTLs extended until the origin server is restored. Even purged content can be restored if it cannot be cached from the origin server, in order to proceed with a smooth service. The goal is to not expose the error status of the servers to the clients as much as possible. If a request for new content is made with a complete error status, the following error page and reason will be displayed.
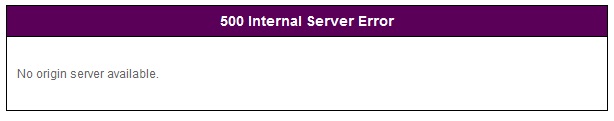
You’d want to avoid showing this page as much as possible.
Time Units and Expressions
For values with a base unit of “seconds”, a string can instead be used for easier time expression. The following are the supported time expressions as well as their values converted to seconds.
| Expression | Conversion |
|---|---|
| year(s) | 31536000 sec (365 days) |
| month(s) | 2592000 sec (30 days) |
| week(s) | 604800 sec (7 days) |
| day(s) | 86400 sec (24 hours) |
| hour(s) | 3600 sec (60 min) |
| minute(s), min(s) | 60 sec |
| second(s), sec(s), (omitted) | 1 sec |
The following expression, using combined units, can be used for time.
1year 3months 2weeks 4days 7hours 10mins 36secs
This can currently be used for the following values.
- Time expression of Custom TTL
- Everything but the Ratio of TTL
- ClientKeepAliveSec
- ConnectTimeout
- ReceiveTimeout
- BypassConnectTimeout
- BypassReceiveTimeout
- ReuseTimeout
- Cycle property of Recovery
- Bandwidth Throttling
Emergency Mode
Internally, all virtual hosts share MemoryBlocks to manage data. If new memory is necessary, old MemoryBlocks that aren’t being used can be reused as new memory. This process is called Memory-Swap. Using this structure can guarantee stability even for long periods of service.
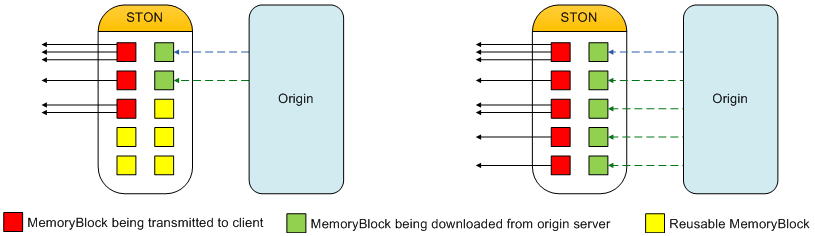
Content is loaded onto a MemoryBlock before being delivered.
Like in the right diagram of the above image, a situation may occur where all MemoryBlocks are in use with no reusable MemoryBlocks. In this case, Memory-Swap will be unavailable. For example, if all the clients are each downloading different parts of data at the same time, and the origin server is transferring different parts of data, then this worst-case scenario can occur. In this case, one solution is to have the system allot more memory to use. However, if the situation continues, memory usage can easily increase. An excessive use of memory can lead to a system memory swap or, at worst, the OS forcing STON to quit.
Note
Emergency mode refers to the mode where, when there is not enough memory, STON temporarily prevents new MemoryBlocks from being alloted.
STON will be put into emergency mode to prevent excessive memory usage, and the mode will be automatically lifted when enough reusable MemoryBlocks can be guaranteed.
# server.xml - <Server><Cache>

<EmergencyMode>OFF</EmergencyMode>
<EmergencyMode>OFF (default)Emergency mode is not used.ONEmergency mode is used.
In emergency mode, STON behaves as follows.
Content that is already loaded will be provided normally.
Bypasses will work normally.
Content not loaded will return 503 service temporarily unavailable. TCP_ERROR statuses will increase.
Idle client sockets will be quickly taken care of.
New content will be unable to be cached.
Expired content will not be renewed.
The cache.vhost.status in SNMP and the Host.State value in XML/JSON statistics will return “Emergency”.
The info log will record the activation/inactivation of emergency mode as below.
2013-08-07 21:10:42 [WARNING] Emergency mode activated. (Memory overused: +100.23MB)
...(omitted)...
2013-08-07 21:10:43 [NOTICE] Emergency mode inactivated.
Disk Hot-Swap
Swaps the disks without stopping the service. The parameters must be the same as those in <Disk>.
http://127.0.0.1:10040/command/unmount?disk=...
http://127.0.0.1:10040/command/umount?disk=...
The excluded disk is immediately inactivated and all content saved on the disk is invalidated. The status of the disk excluded by the administrator is set to “Unmounted”.
To reactivate the disk, the following should be called.
http://127.0.0.1:10040/command/mount?disk=...
All content in the reactivated disk is invalidated.
SyncStale
After an abnormal service termination, content that has been invalidated by Purge, Expire, or HardPurge may be skipped over by indexing (due to performance reasons). To make up for this, the API calls will be logged and go into effect when the service is restarted.
# server.xml - <Server><Cache>

<SyncStale>ON</SyncStale>
<SyncStale>ON (default)Synchronizes on restart.OFFIgnores.
The log can be found at ./stale.log and is initialized upon normal termination or regular indexing.